My Data Posts
Welcome to my website! I'm a political scientist and doctoral researcher working at the intersection of data and public policy.
Most of my research focuses on quantitative analysis, looking at welfare states and labor markets.
Over time, I’ve realized that the way we present data matters just as much as the data itself.
This page collects my ongoing experiments in data visualization: from scatterplots to pie charts, between font size and color choices, static to interactive.
While I usually work in R, all the charts here are made in Python as part of my effort to deepen my skills and explore new workflows.
It’s as much a design project as it is a learning journey.
Some posts are explanatory, others more playful or reflective.
I'm still figuring out what style fits best, and I genuinely welcome your feedback.
I hope to transition into professional data visualization and analysis after my PhD, so this also serves as a living portfolio.
Latin America and the Caribbean in Numbers
📊 From Human Development to Democracy and LGBTQ+ Rights — explore key regional trends through 5 interactive visualizations.
A data story made entirely in Python as part of my learning journey.
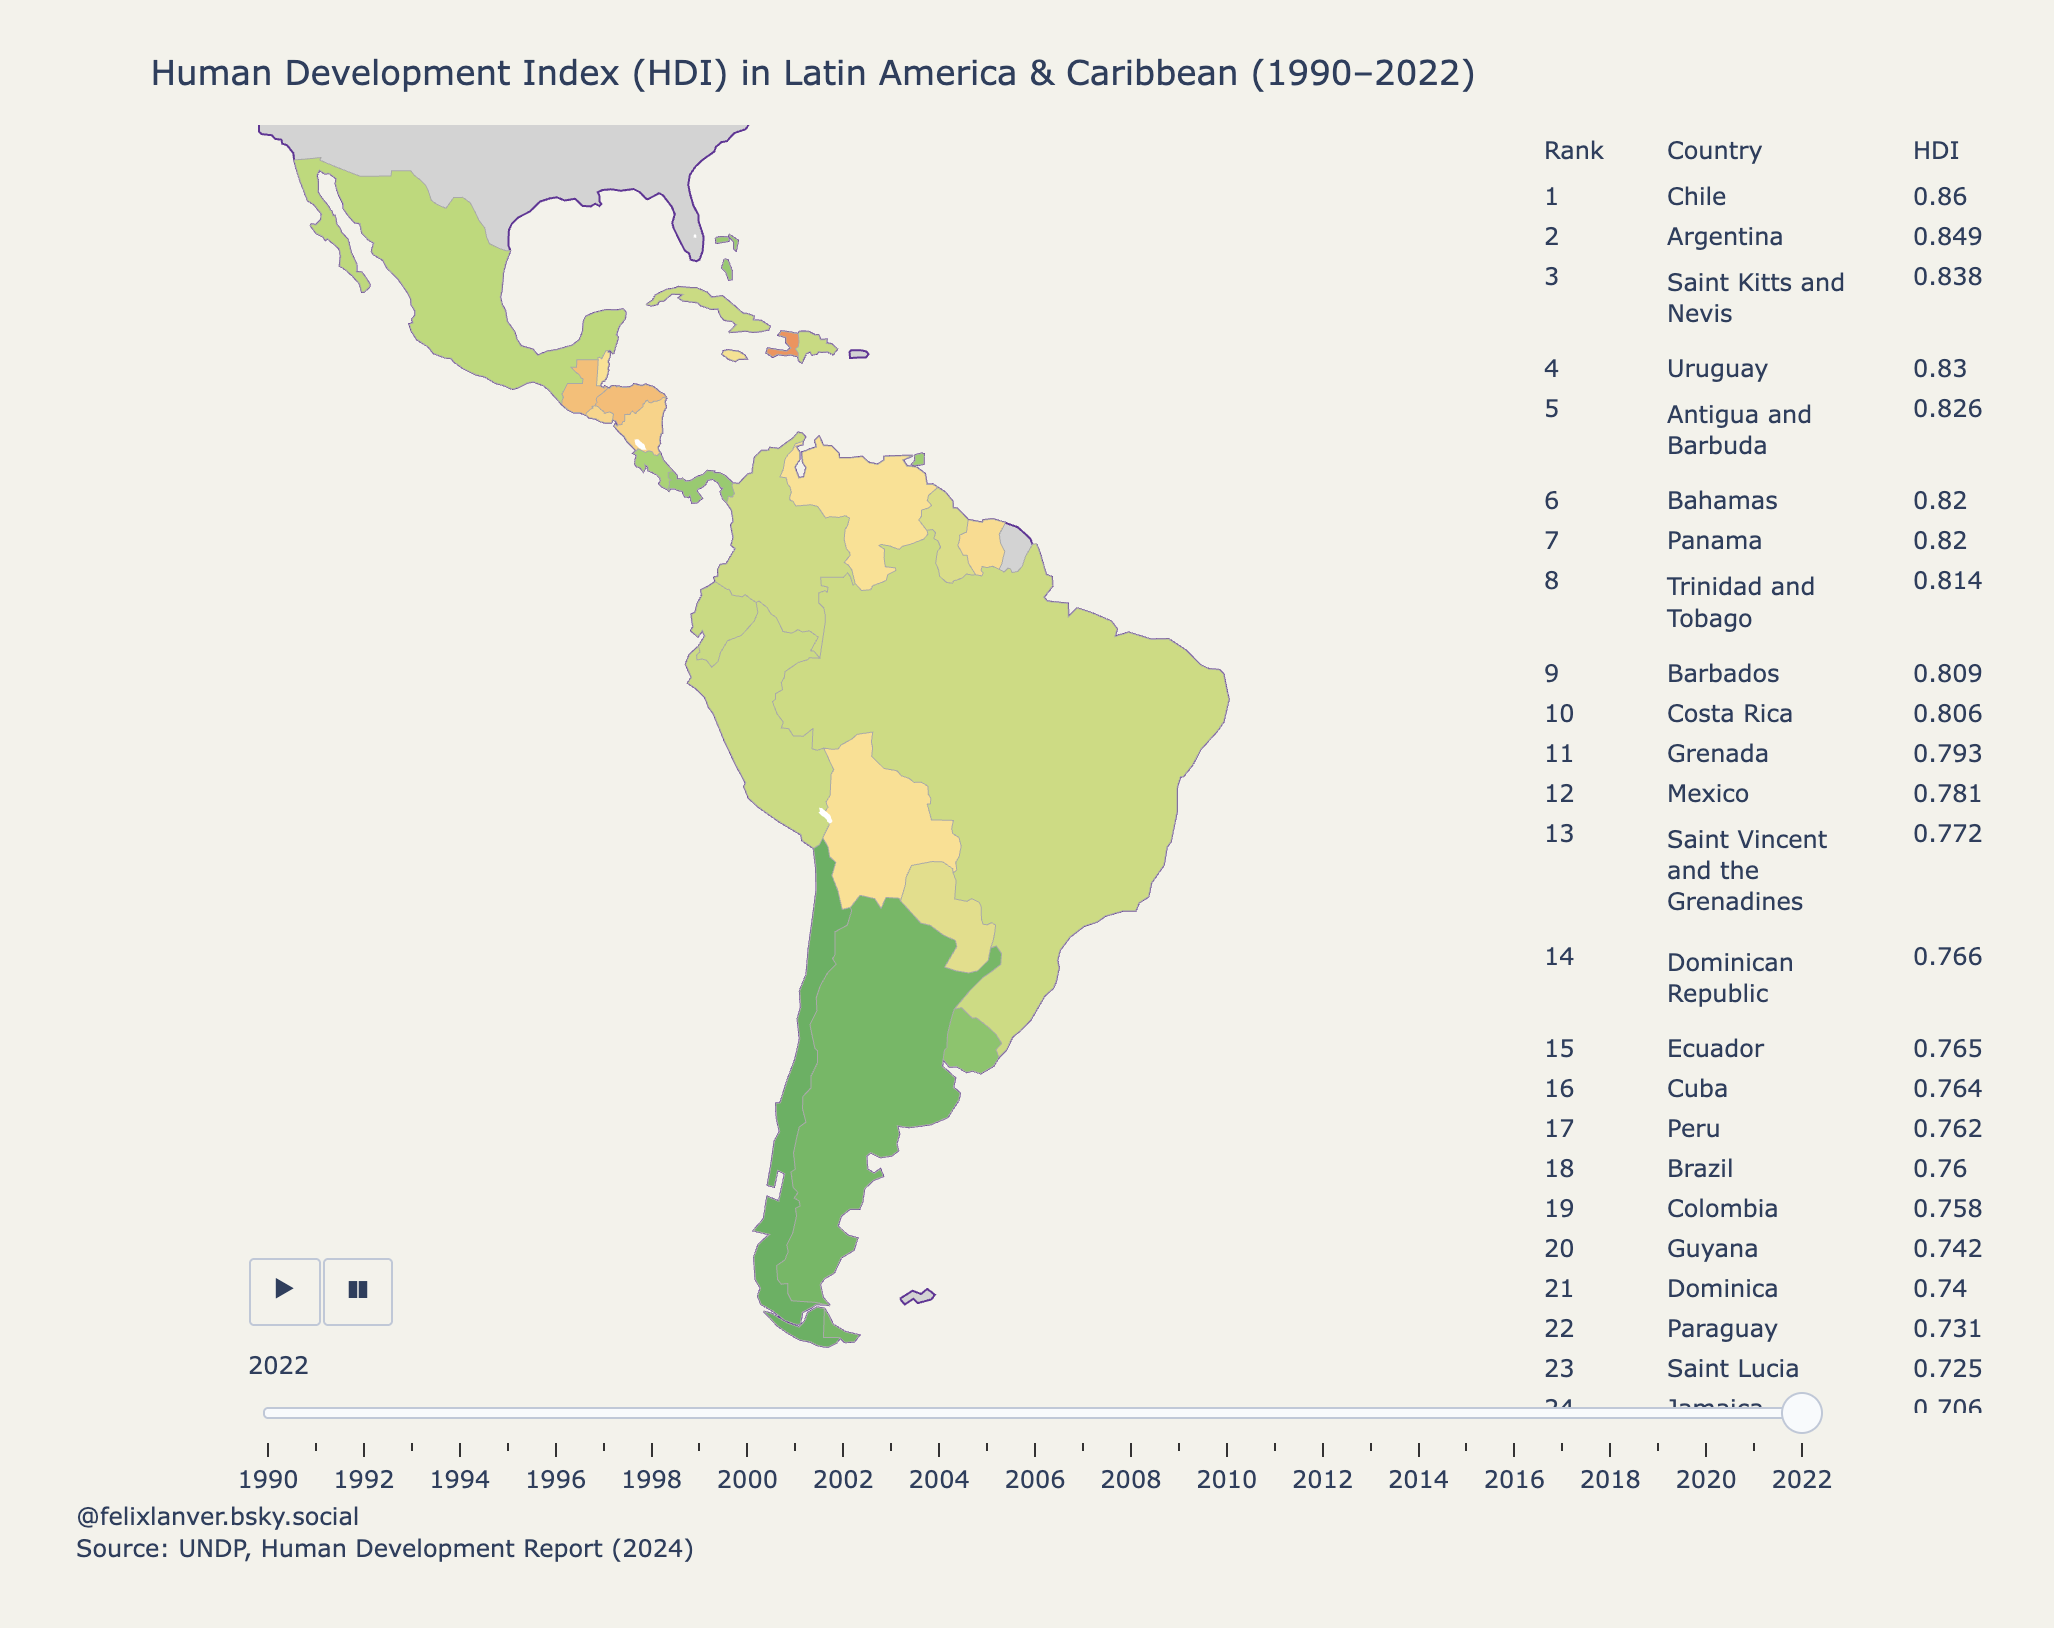
👉 Check out the full data story
here.
World Press Freedom: Interactive Map
🌍 How free is the press around the world?
This animated map shows country-level Press Freedom Index scores from 2020 to 2025.
Use the slider to explore changes over time.
👉 Check out the full data story
here.
City Population
What’s the biggest city in the world?
This chart compares the population of the top 10 cities by three definitions: City Proper, Urban Area, and Metropolitan Area.
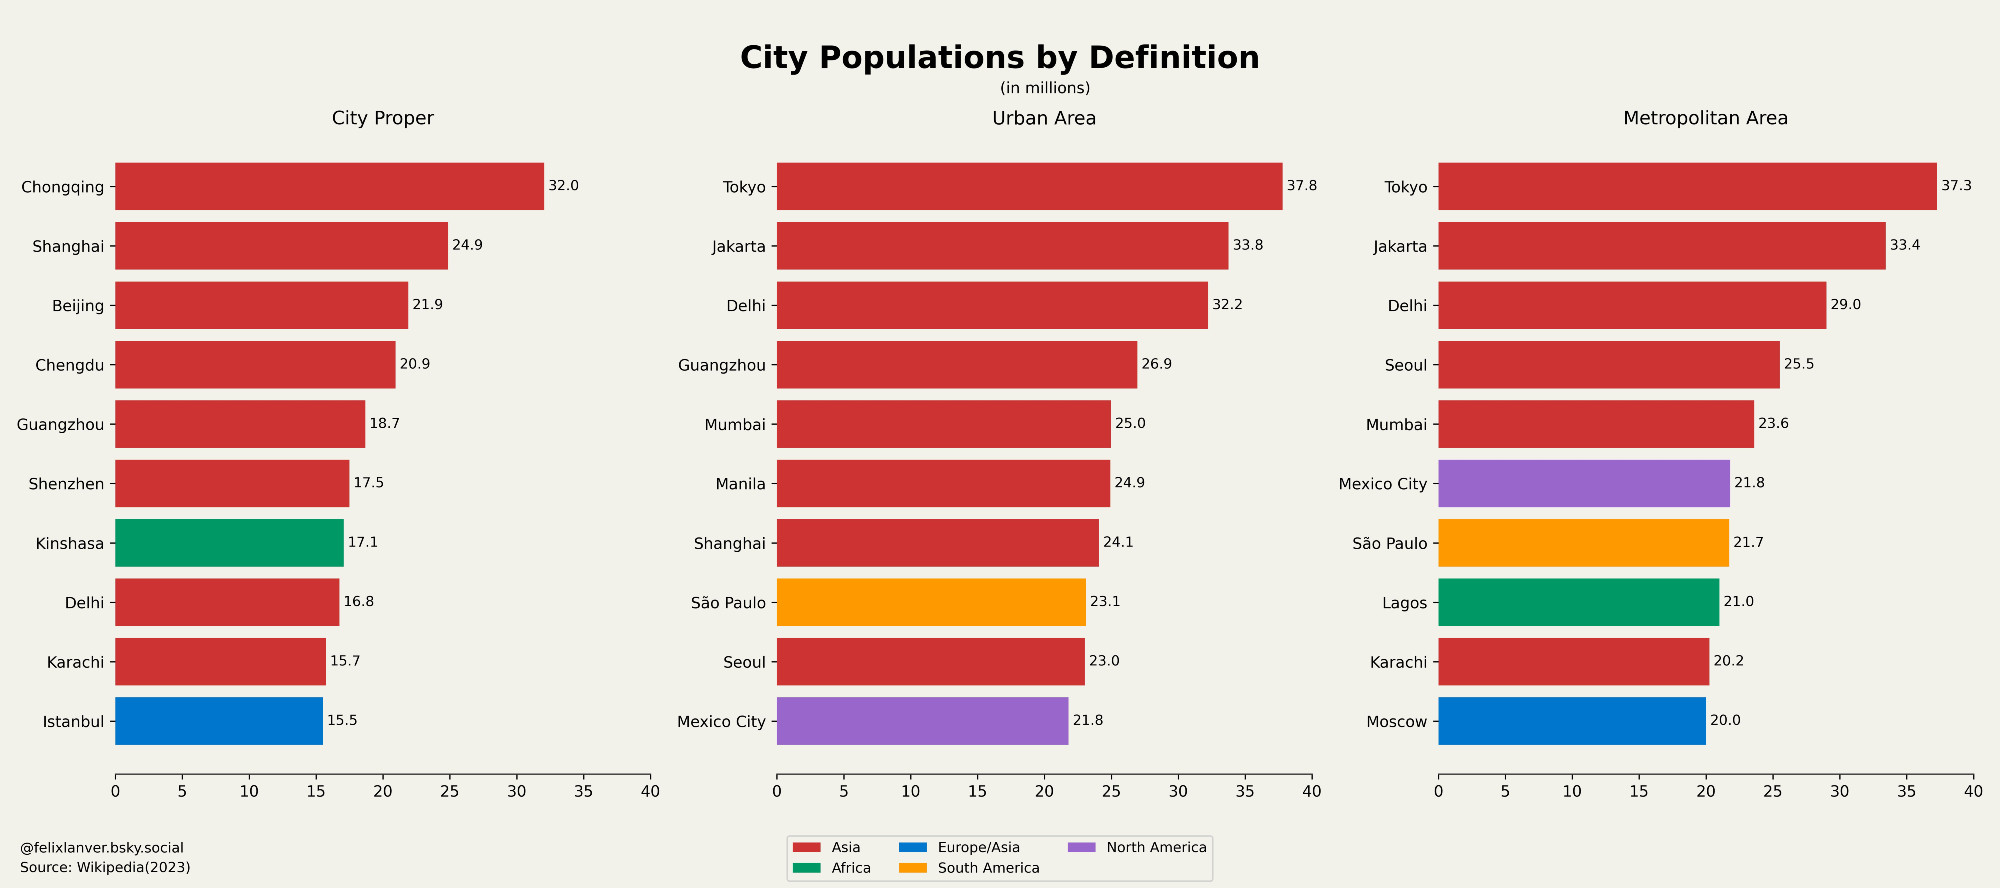
City Proper refers to the population within official administrative boundaries.
This can include vast rural areas, especially in large jurisdictions like Chongqing, China,
where over 70% of the population may live in non-urban settings.
Urban Area focuses on the contiguous built-up environment, disregarding administrative borders.
It offers a more consistent picture of physical city size but varies by national criteria.
Metropolitan Area includes both the urban core and its surrounding commuter belt,
defined by economic and infrastructural ties.
It best reflects a city's functional reach but may vary based on statistical definitions and governance models.
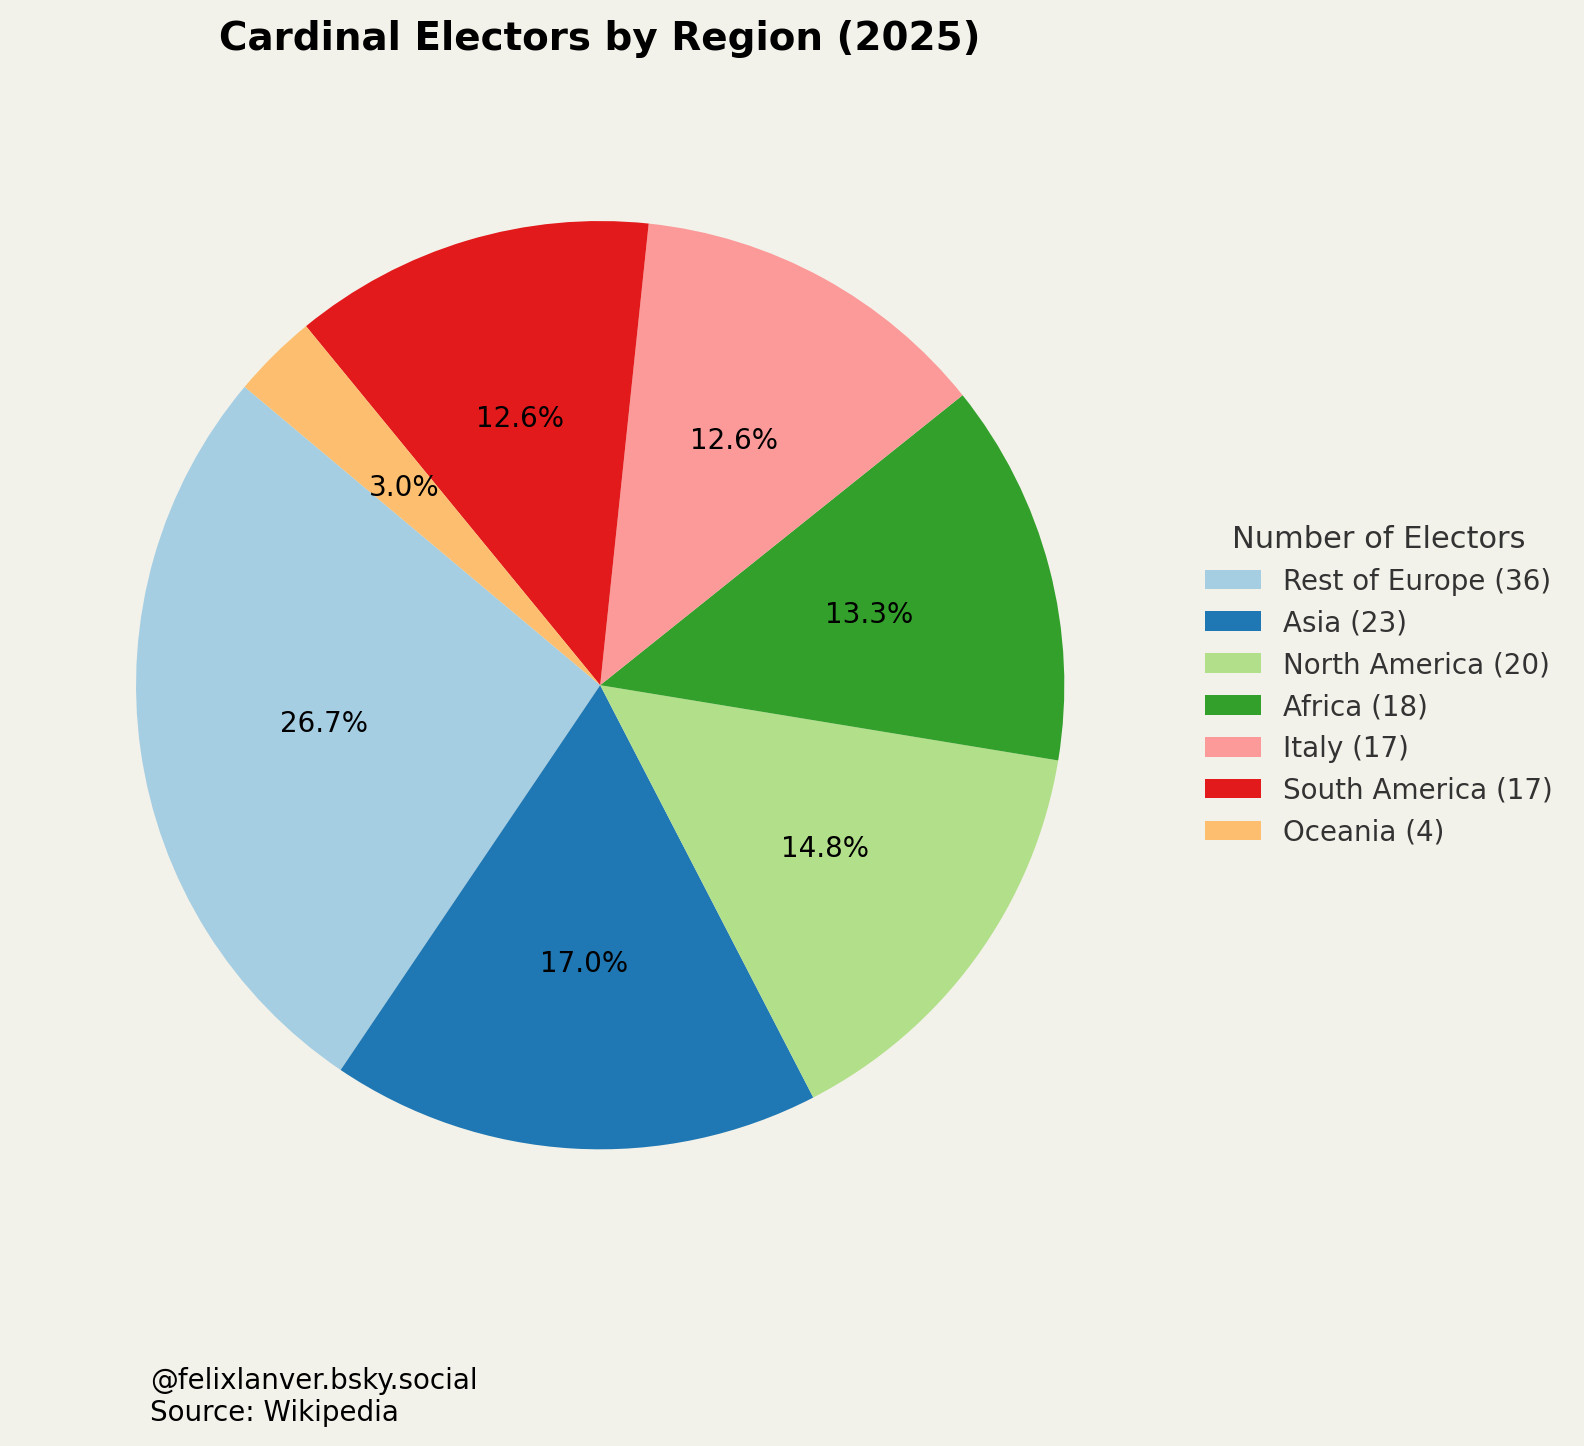
Papal Conclave: Cardinals per Country
The Papal Conclave starts on May 7.
Italy still holds disproportionate influence, but non-European regions are more influential than ever in the College of Cardinals.
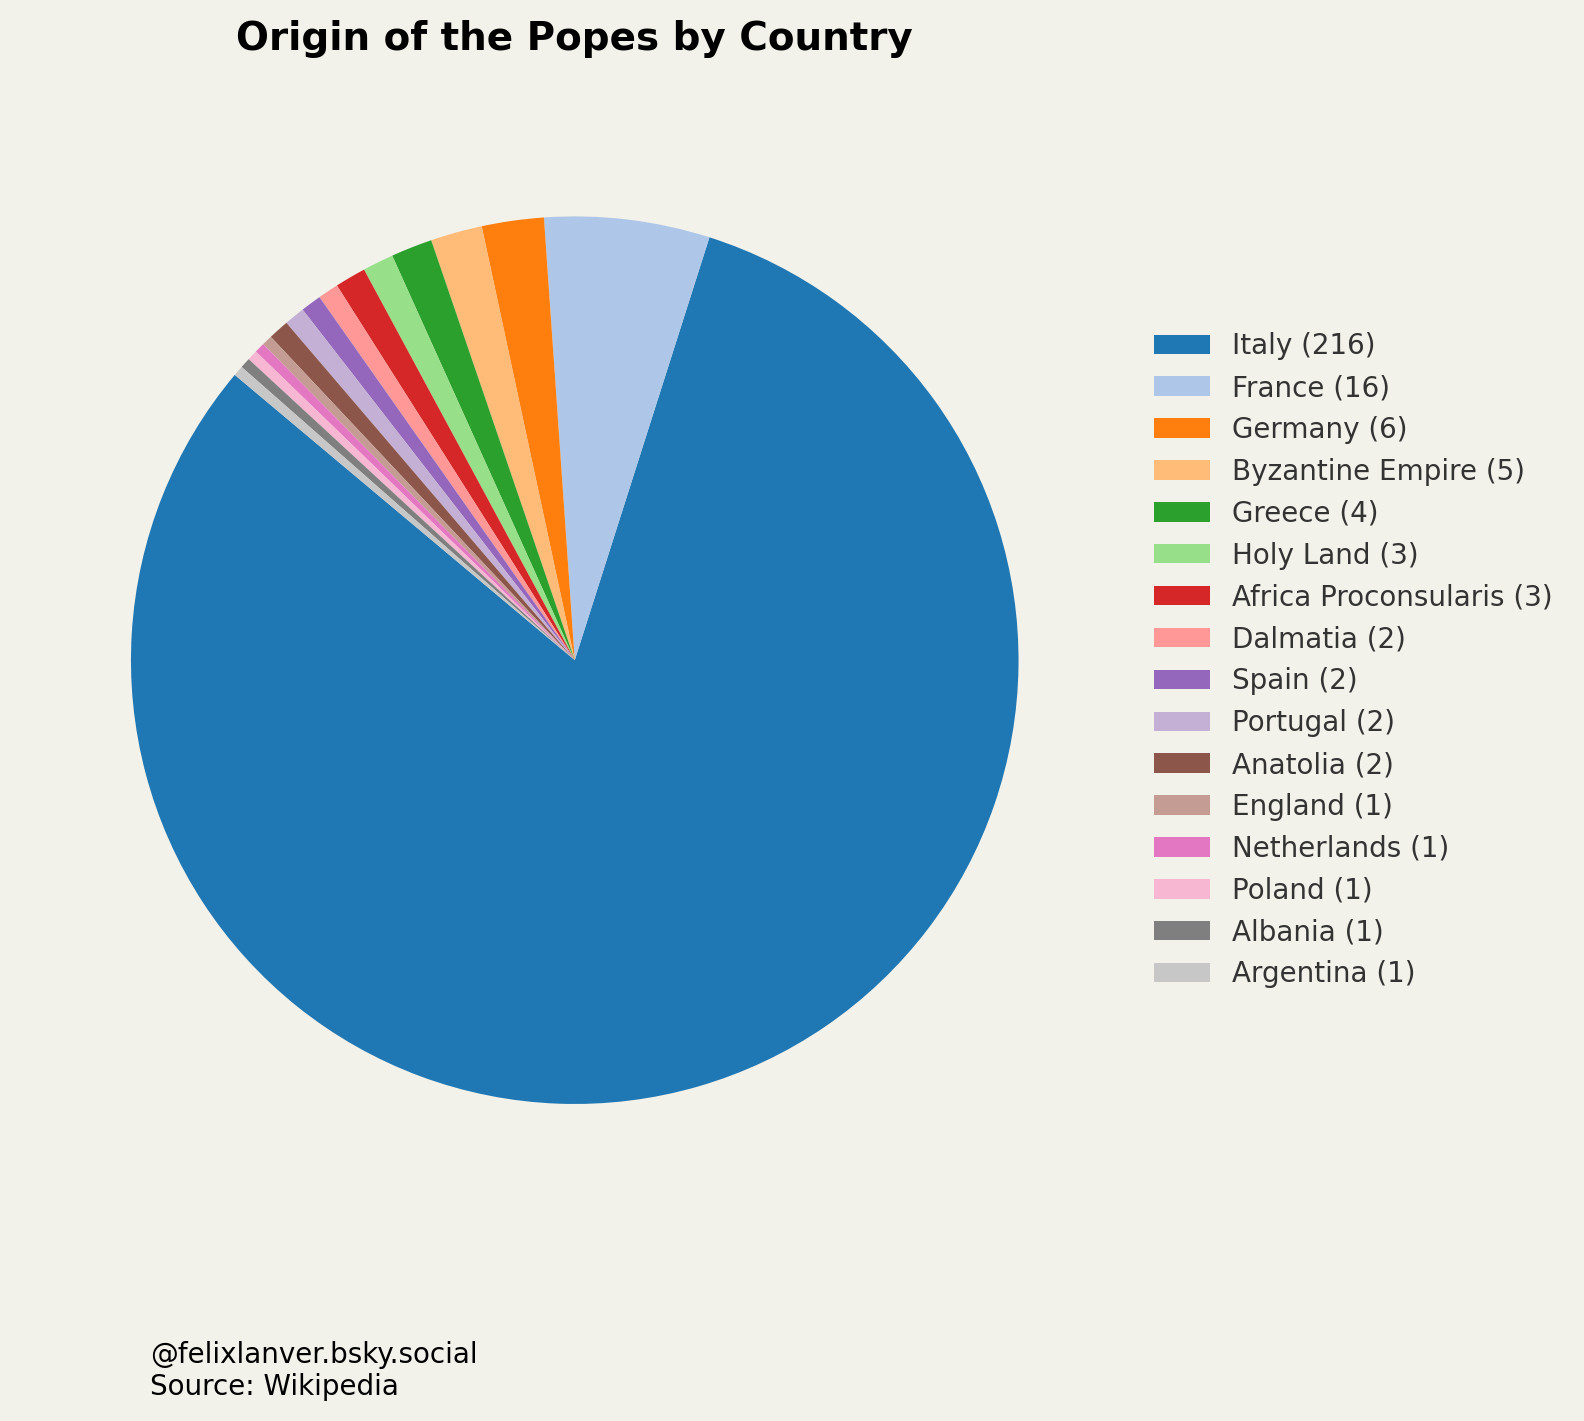
Origins of Popes
🕊 Where did the popes come from?
Out of 266 popes in history, over 80% came from Italy.
But regions like the Byzantine Empire (Syria), Africa Proconsularis (Tunisia), and the Holy Land (Israel/Palestine) also produced popes — especially in the early centuries.
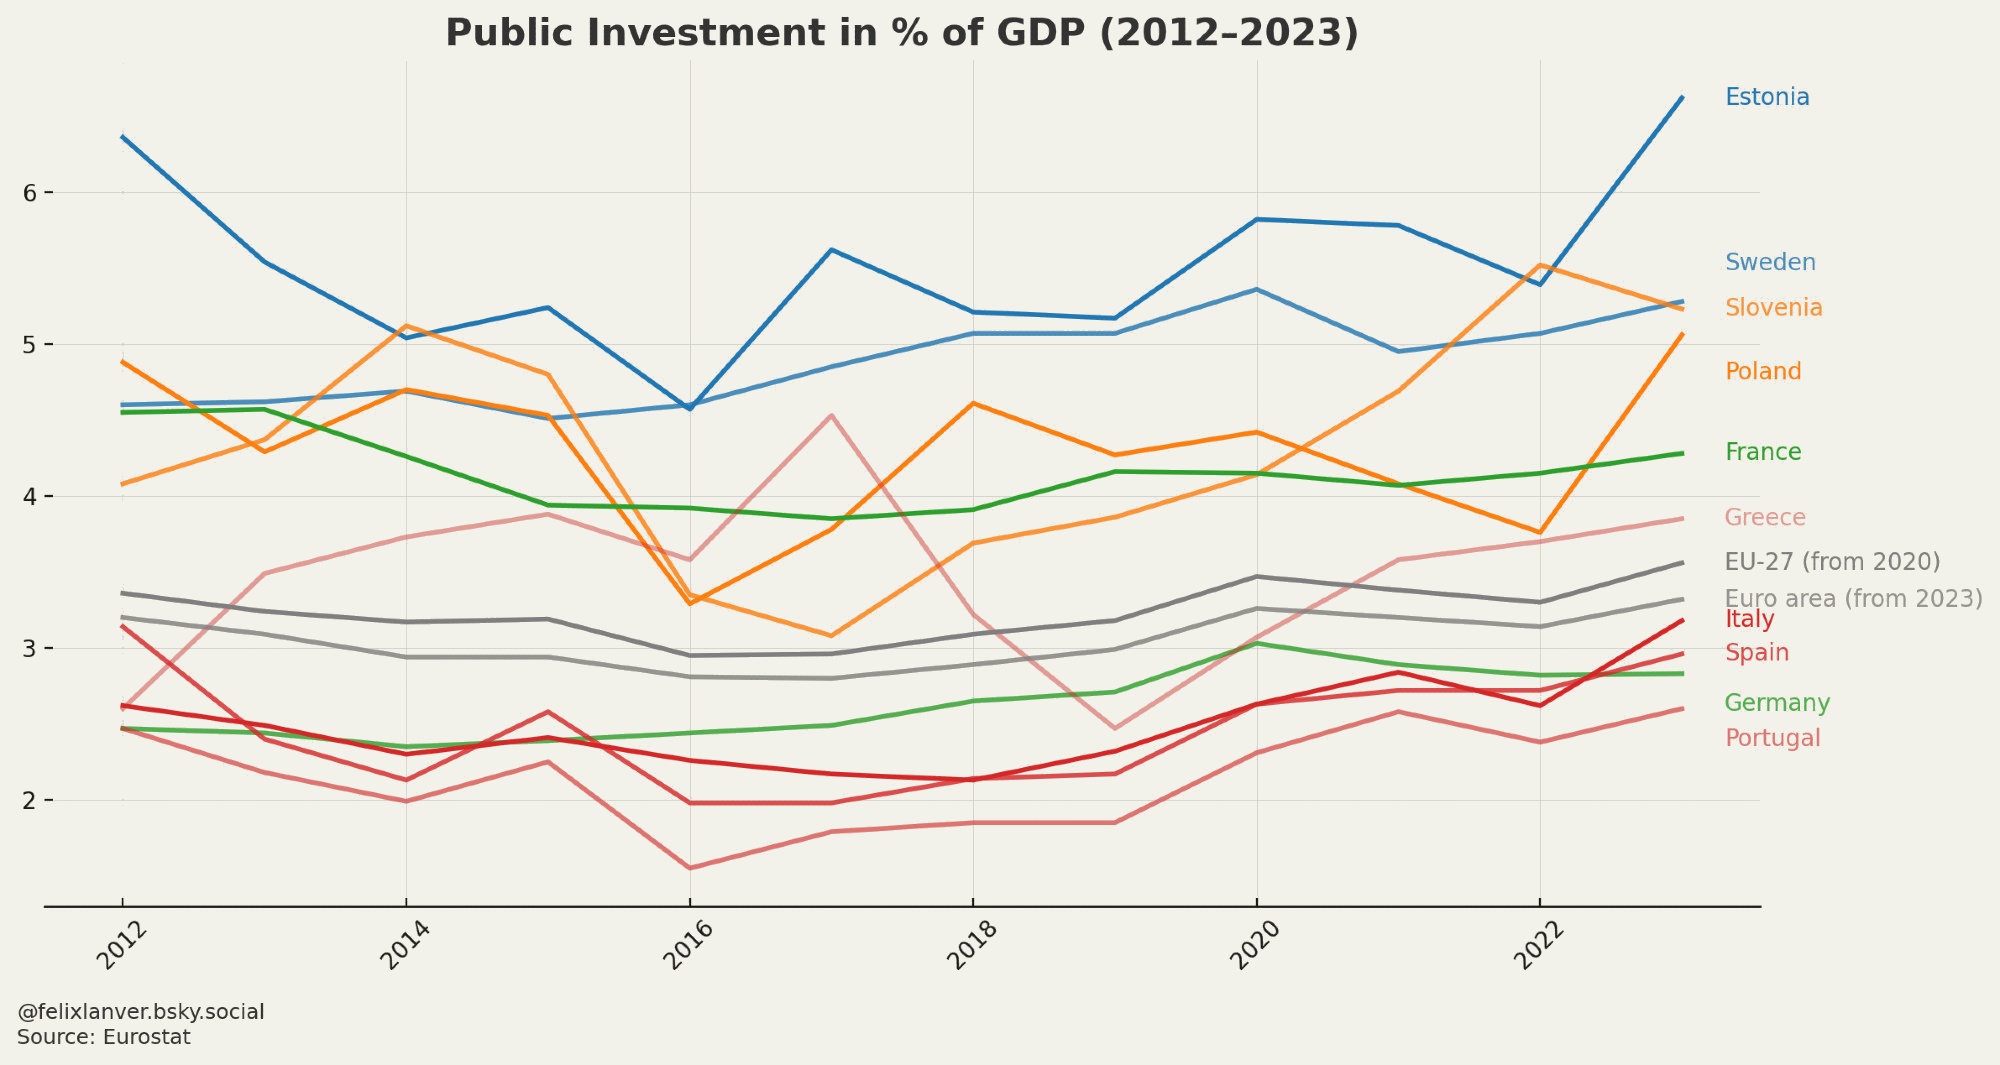
Public Investment
For over a decade, Germany has ranked among the EU’s lowest in public investment.
While countries like Estonia or Sweden invested twice as much, Germany held back.
Will the new €500 billion infrastructure fund be a turning point for Germany’s infrastructure and green transition?
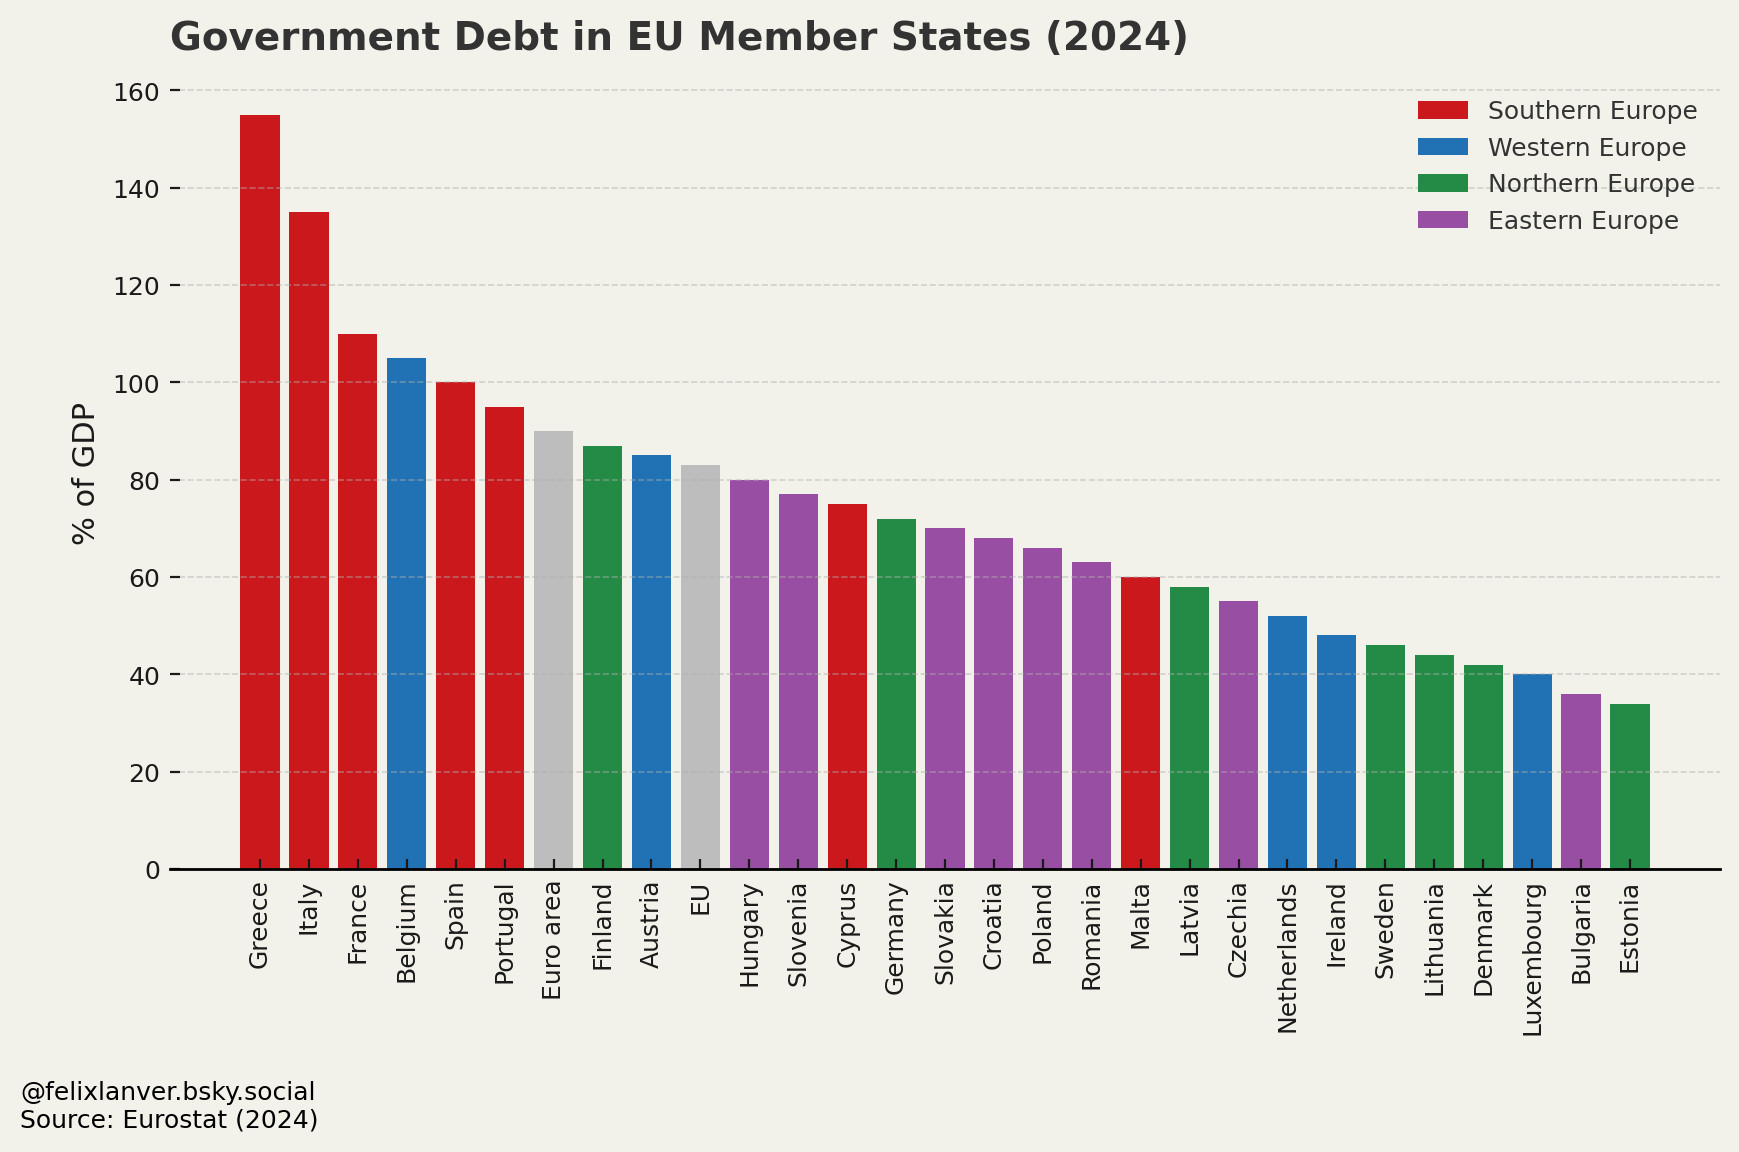
Government Debt in the European Union
📉 Government debt in the EU (2024).
Southern countries remain the most indebted, while many Eastern and Northern members keep their debt ratios low.
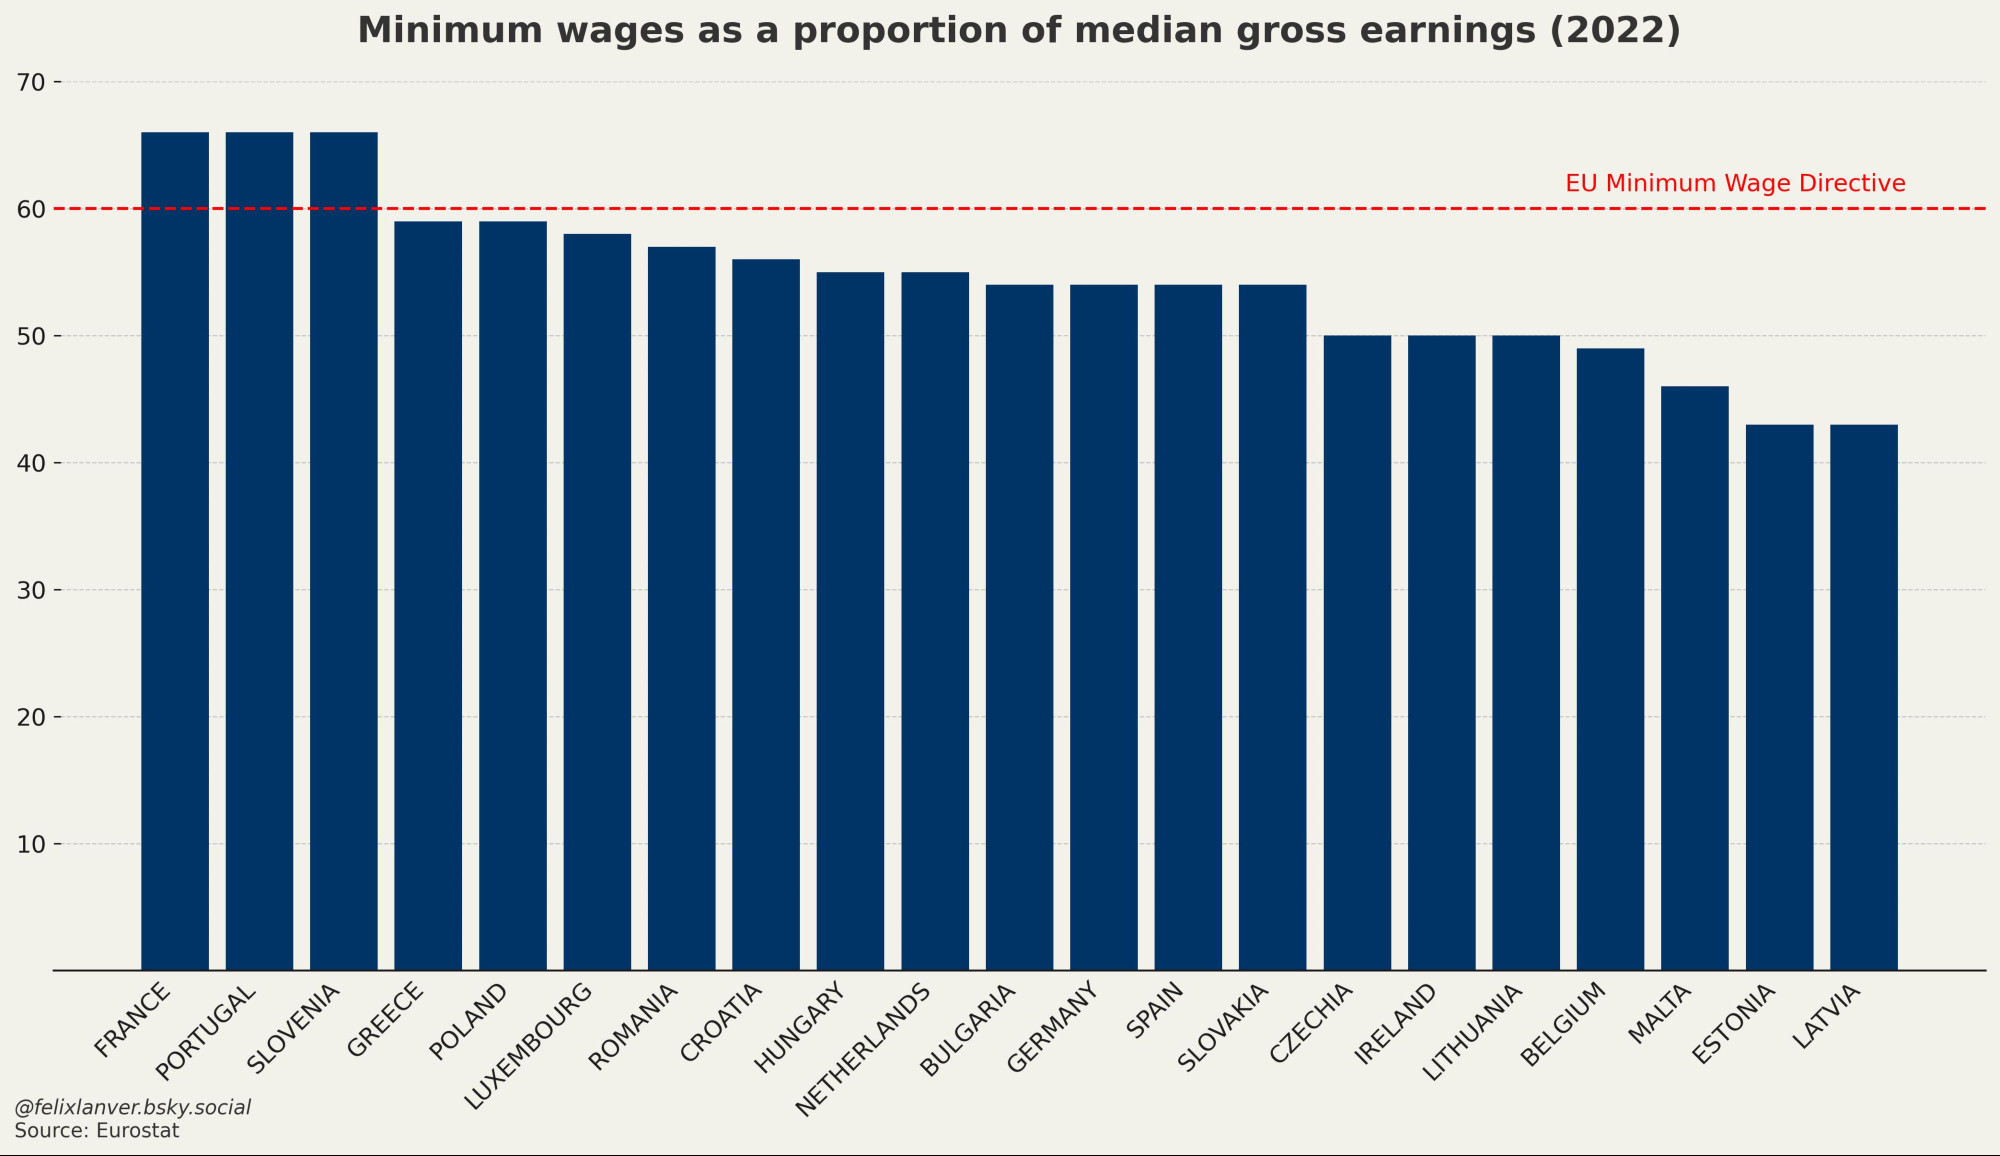
Minimum Wages in the European Union
This chart shows how minimum wages across EU countries compare to the national median gross earnings.
The red line marks the 60% benchmark promoted by the EU Minimum Wage Directive.
Only France, Portugal, and Slovenia meet this goal.
(Data is from 2022; more recent data coming soon.)
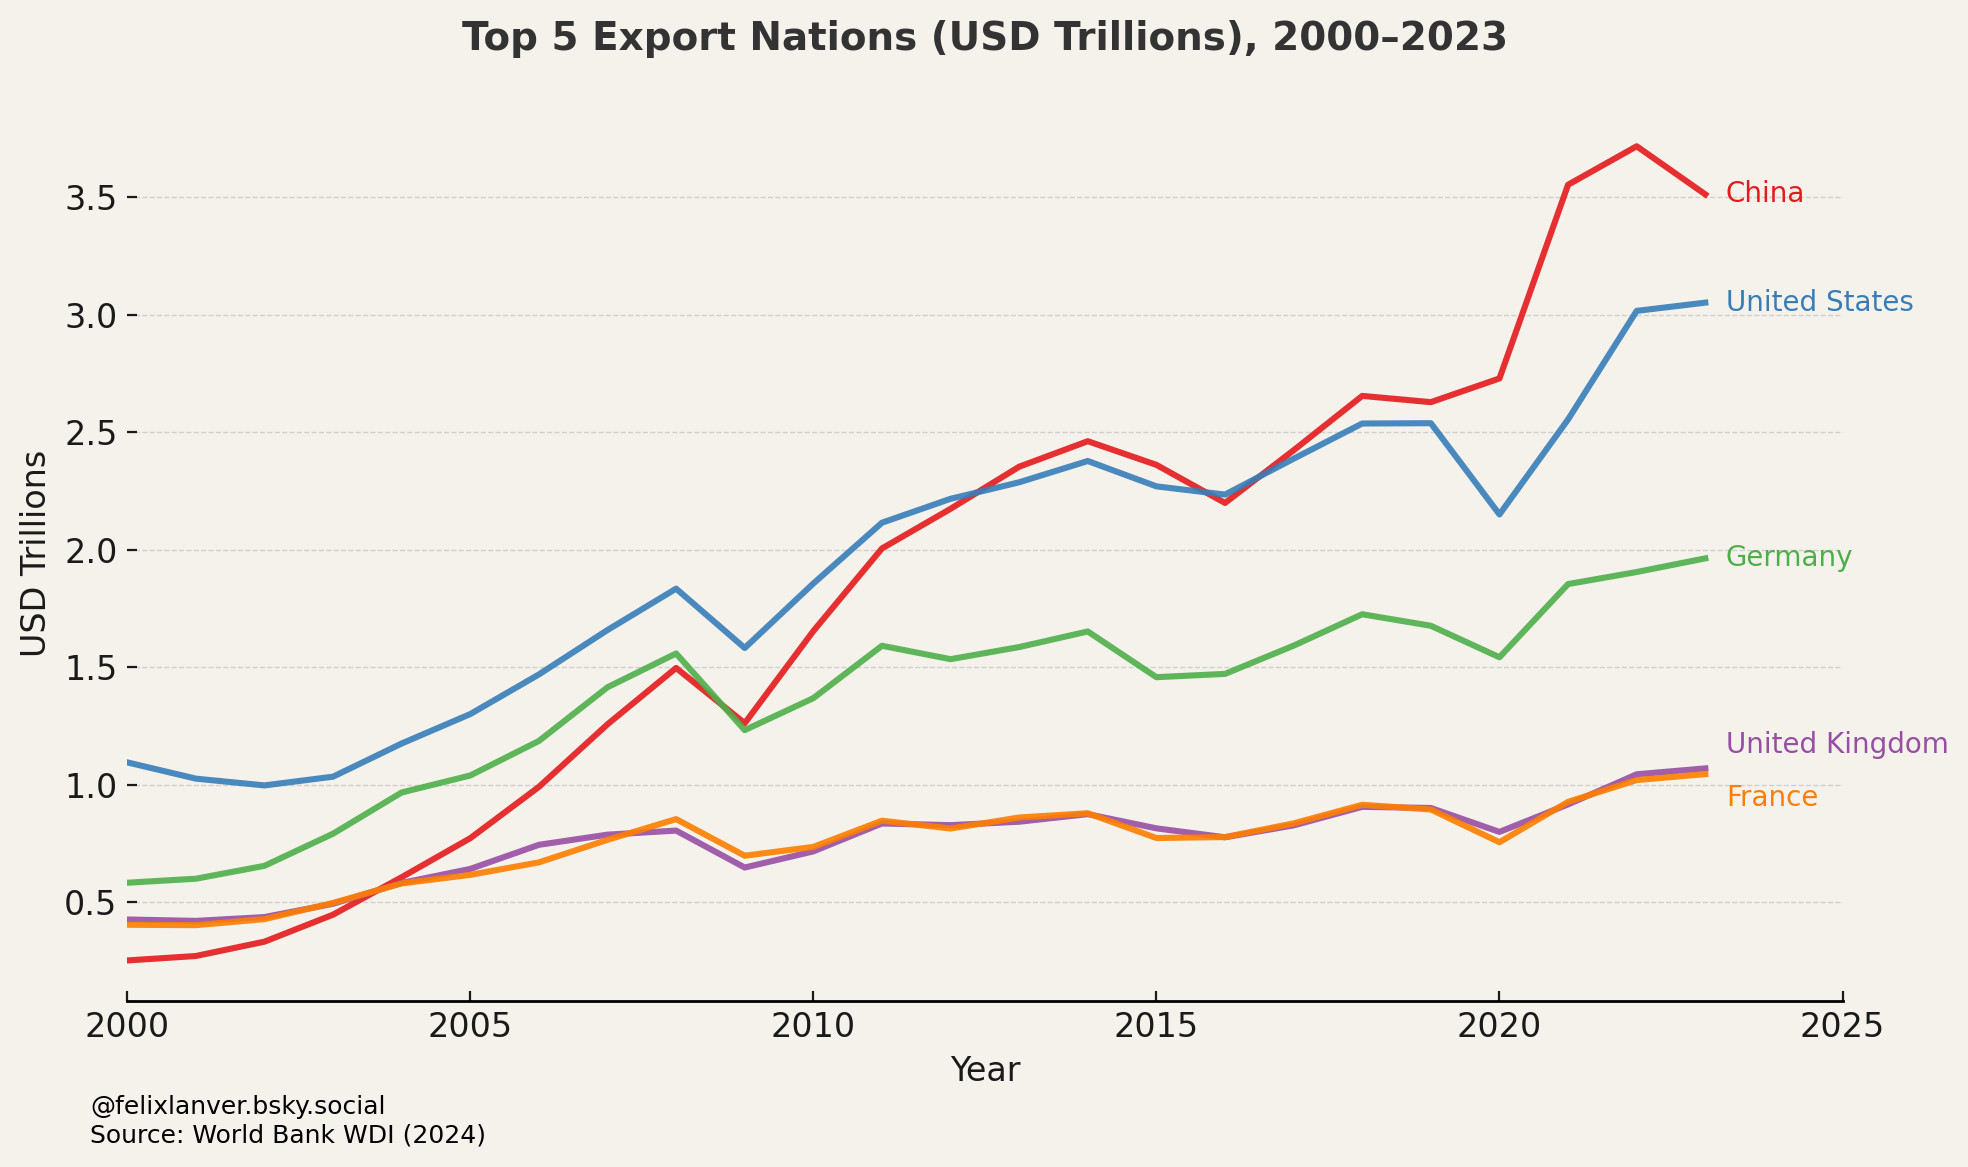
Top Export Nations (Top 5)
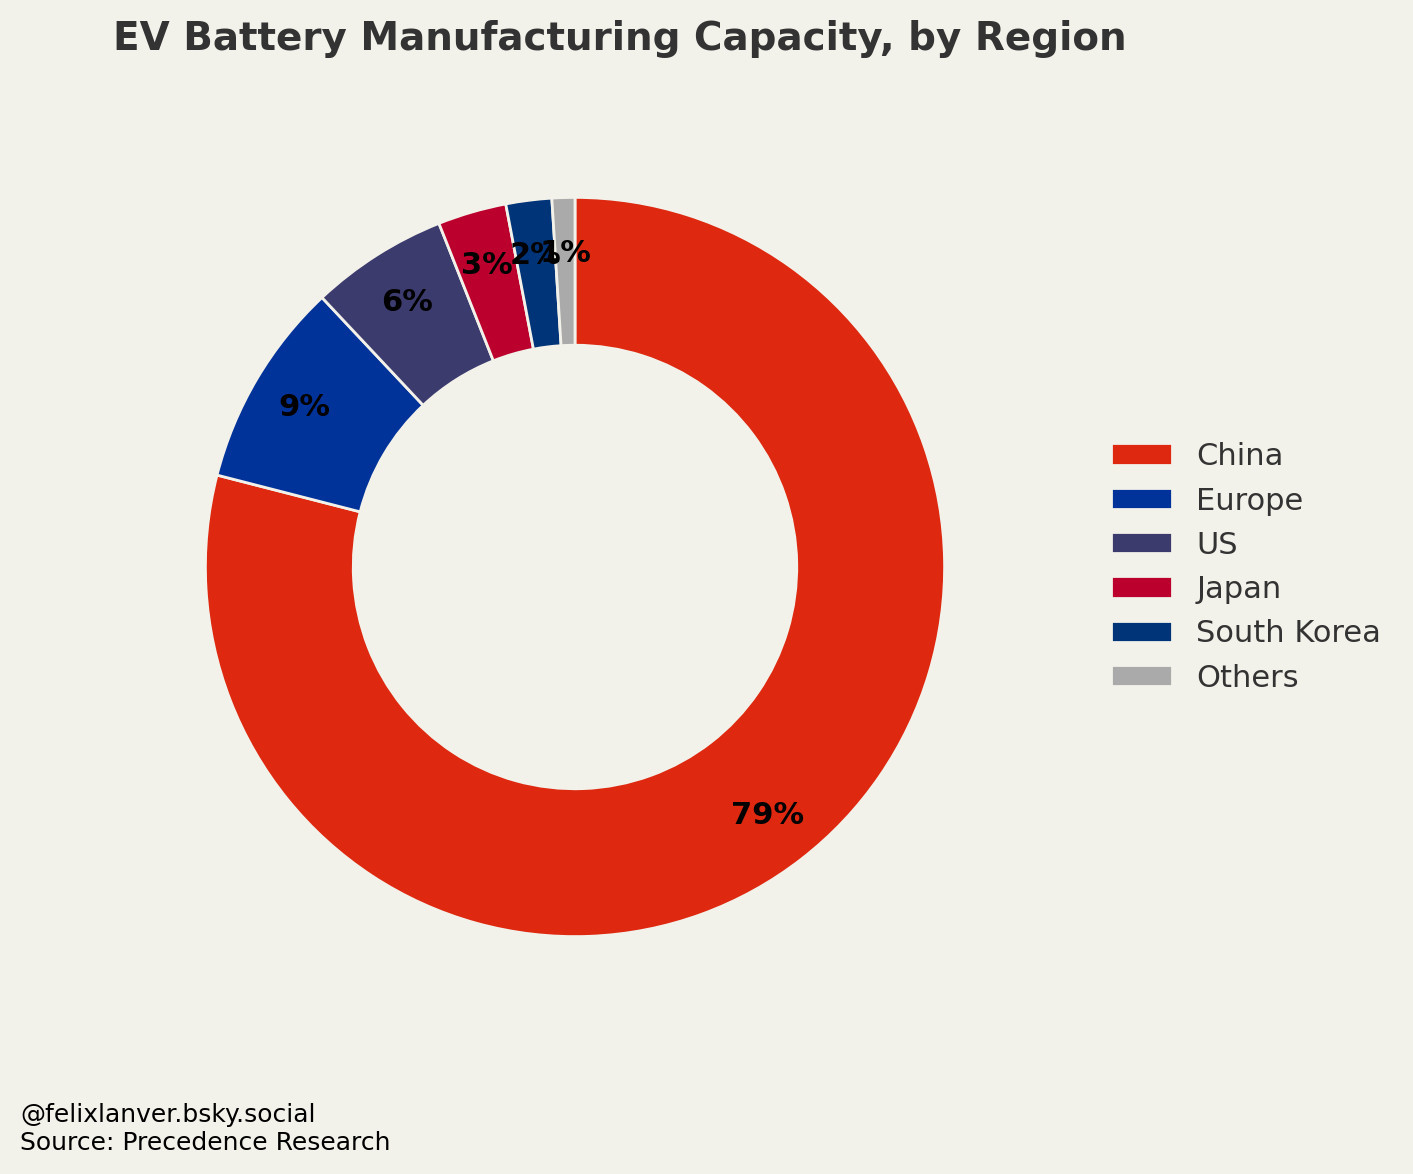
Global EV Battery Production
🔋 Who dominates global EV battery production?
China alone accounts for 79% of global manufacturing capacity.
Europe, the US, Japan, and Korea trail far behind.
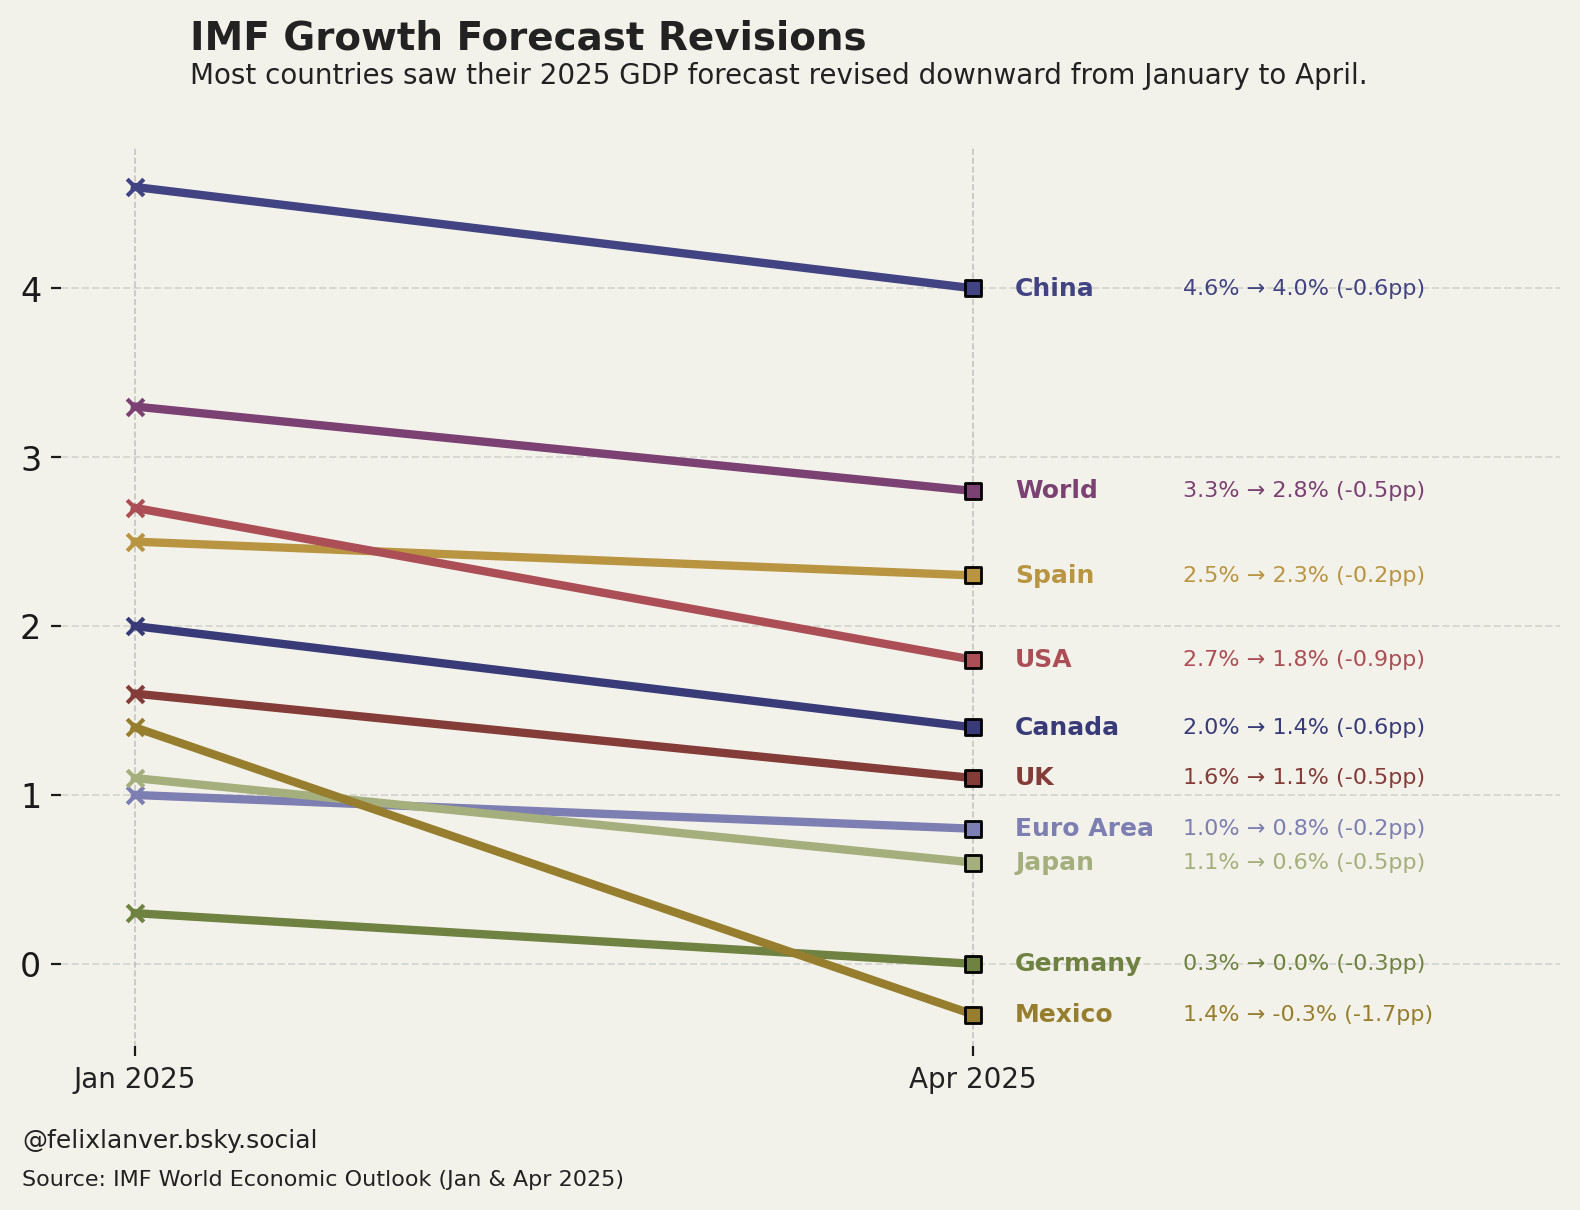
IMF Economic Growth Forecasts
IMF downgrades 2025 growth forecasts sharply for Mexico and the USA.
🇲🇽 Mexico: +1.4% → -0.3% (↓ 1.7pp)
🇺🇸 USA: +2.7% → 1.8% (↓ 0.9pp)
Most major economies are now expected to grow slower than projected just 3 months ago.
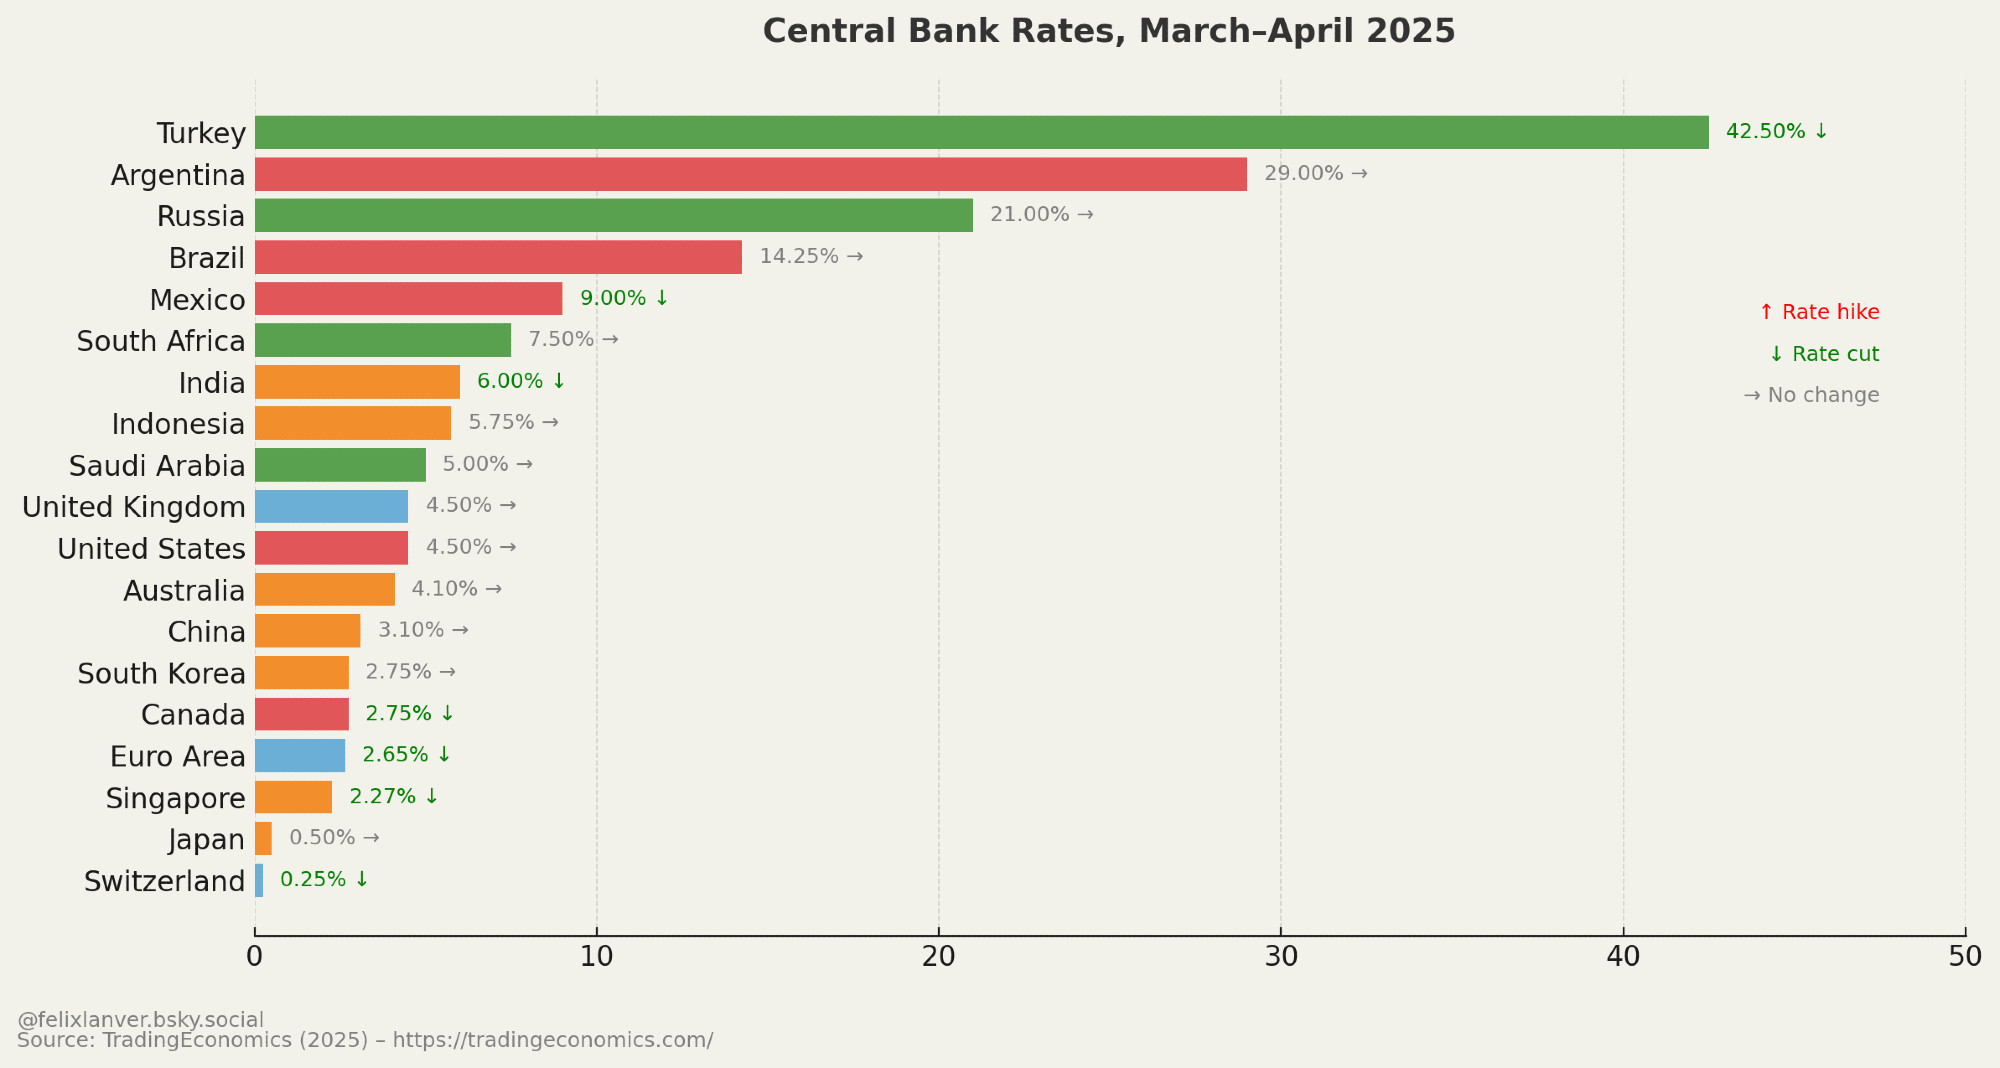
Central Bank Rates
Top 10 Military Spenders
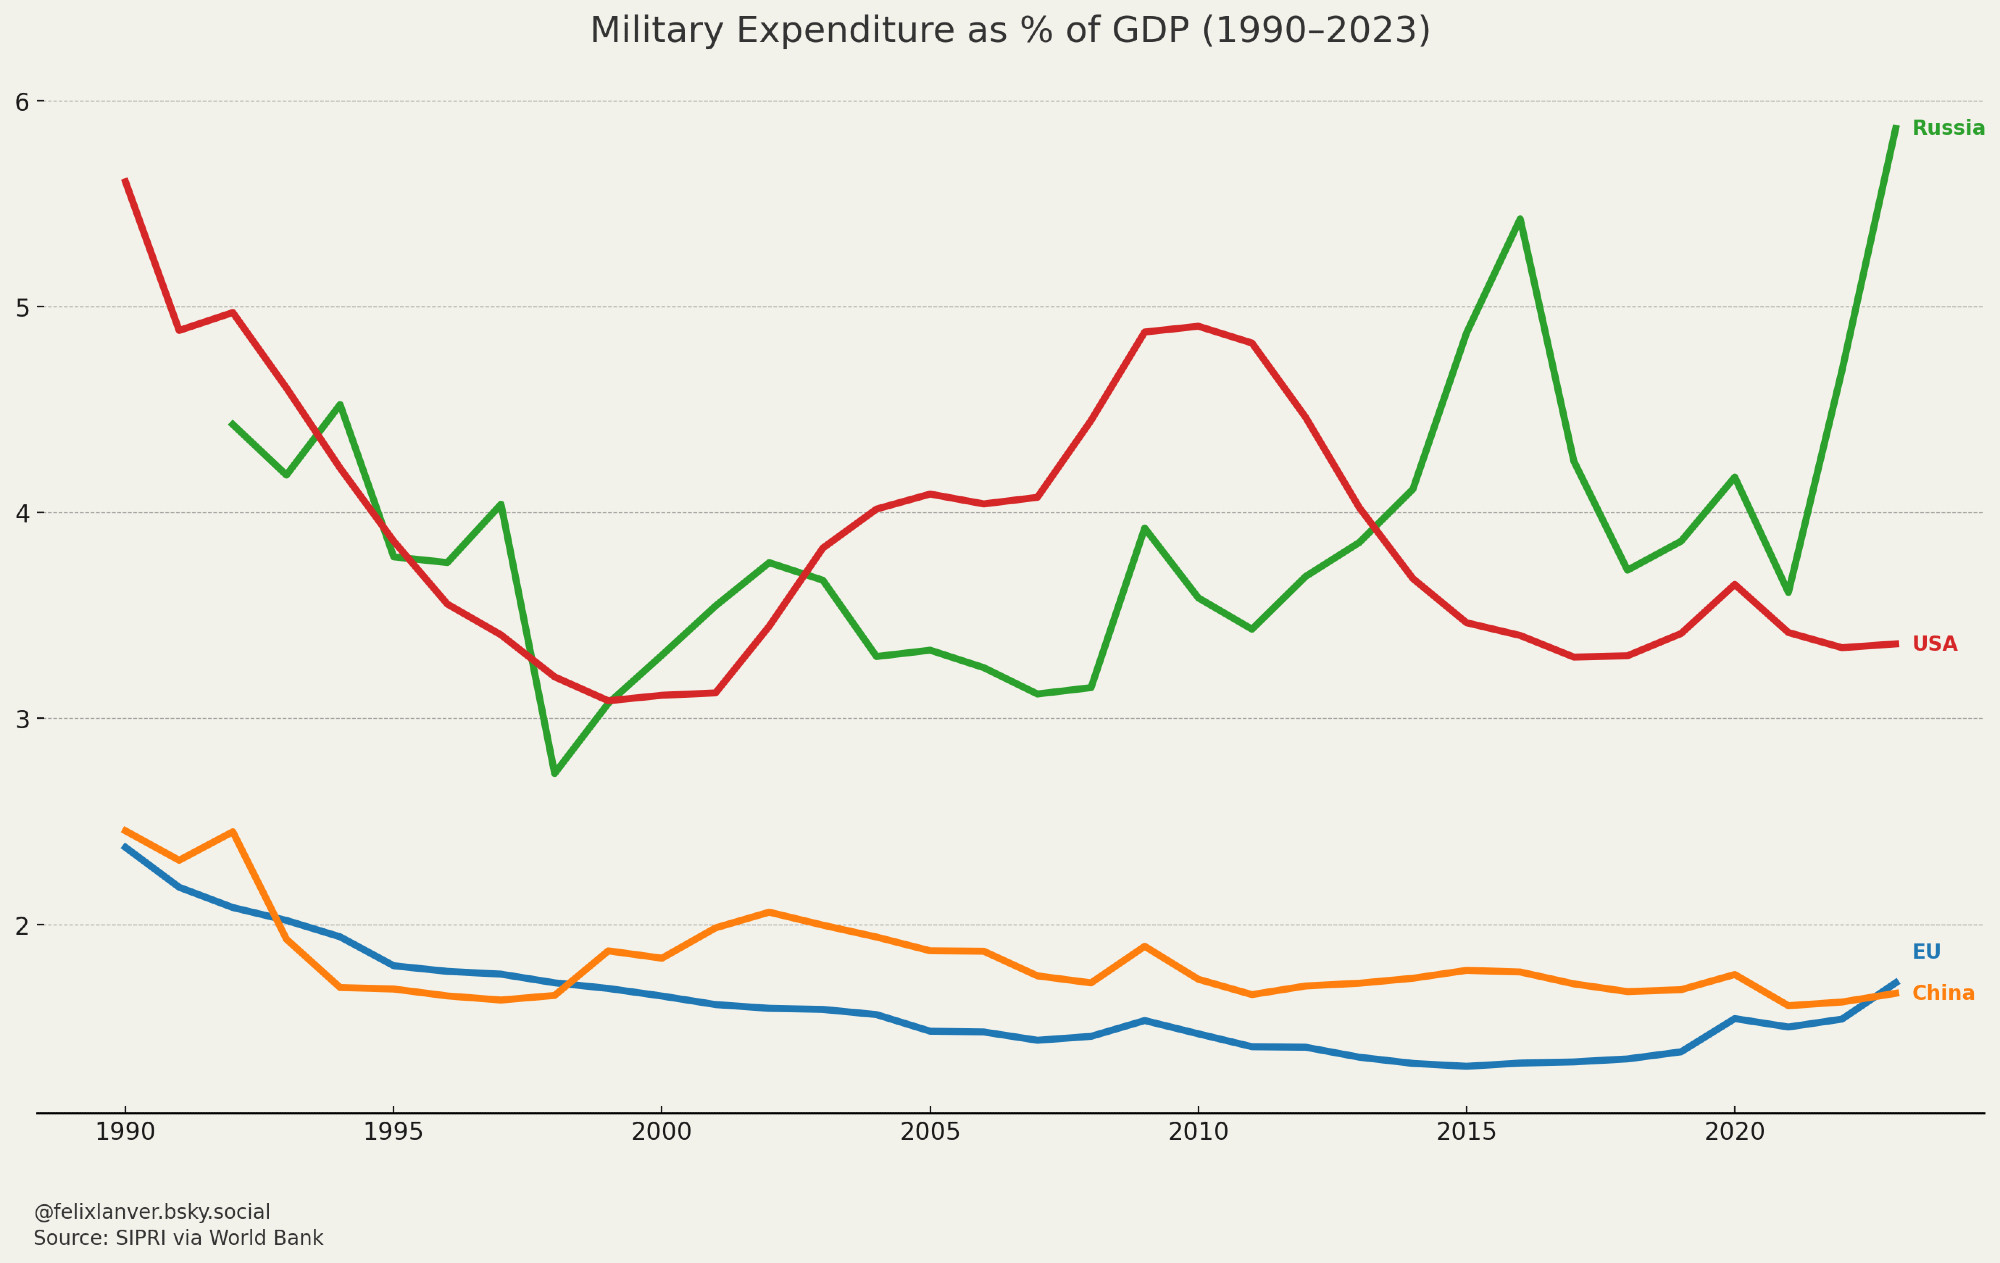
Putin's imperial ambitions are visible in the data.
Following the illegal annexation of Crimea, Russia accelerated its militarization – in sharp contrast to the US and EU.
The surge in spending paved the way for the 2022 full-scale assault on Ukraine.
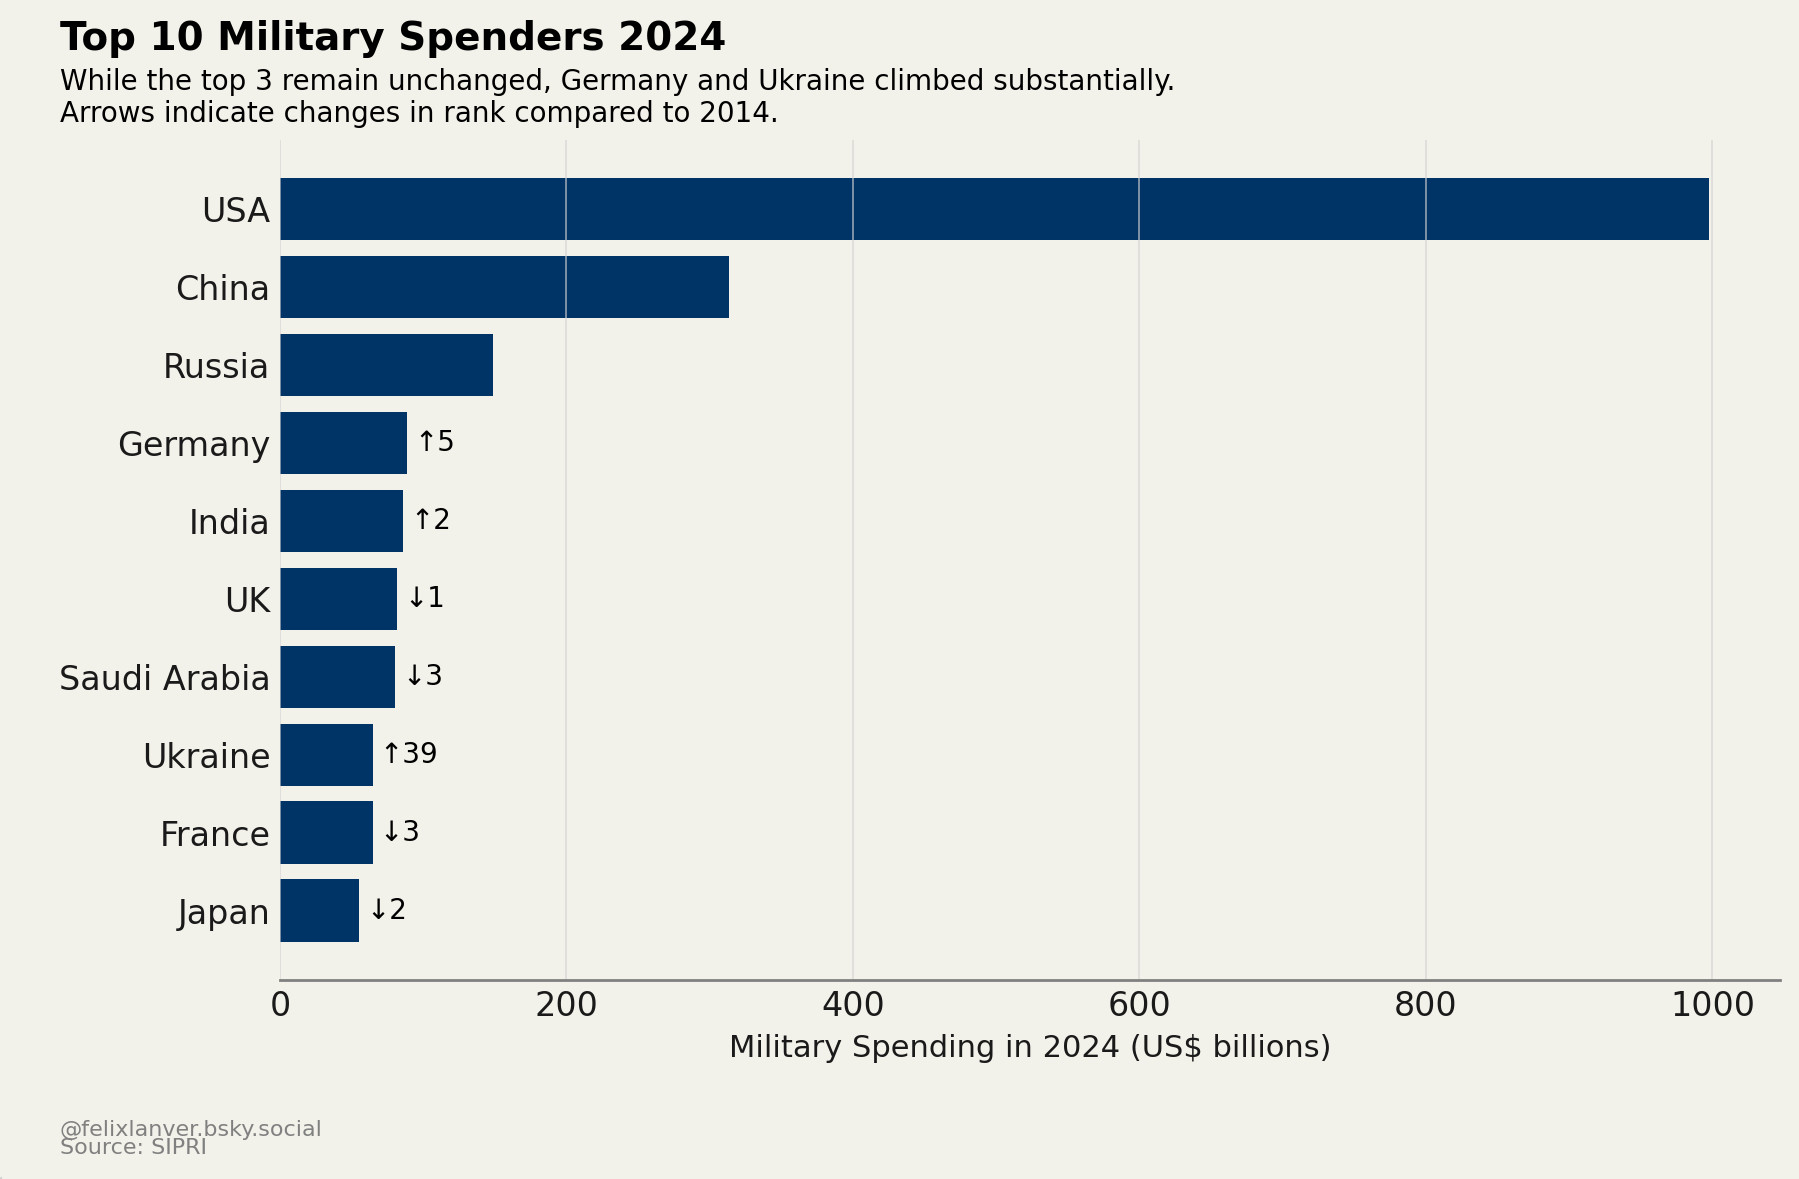
Military Expenditure
The 2025 SIPRI data is out.
The US, China, and Russia remain the world’s largest military spenders – unchanged from a decade ago.
Germany’s €100 billion Sondervermögen for its armed forces propelled the country to 4th place in 2024.
Ukraine’s rise in the ranking speaks for itself.
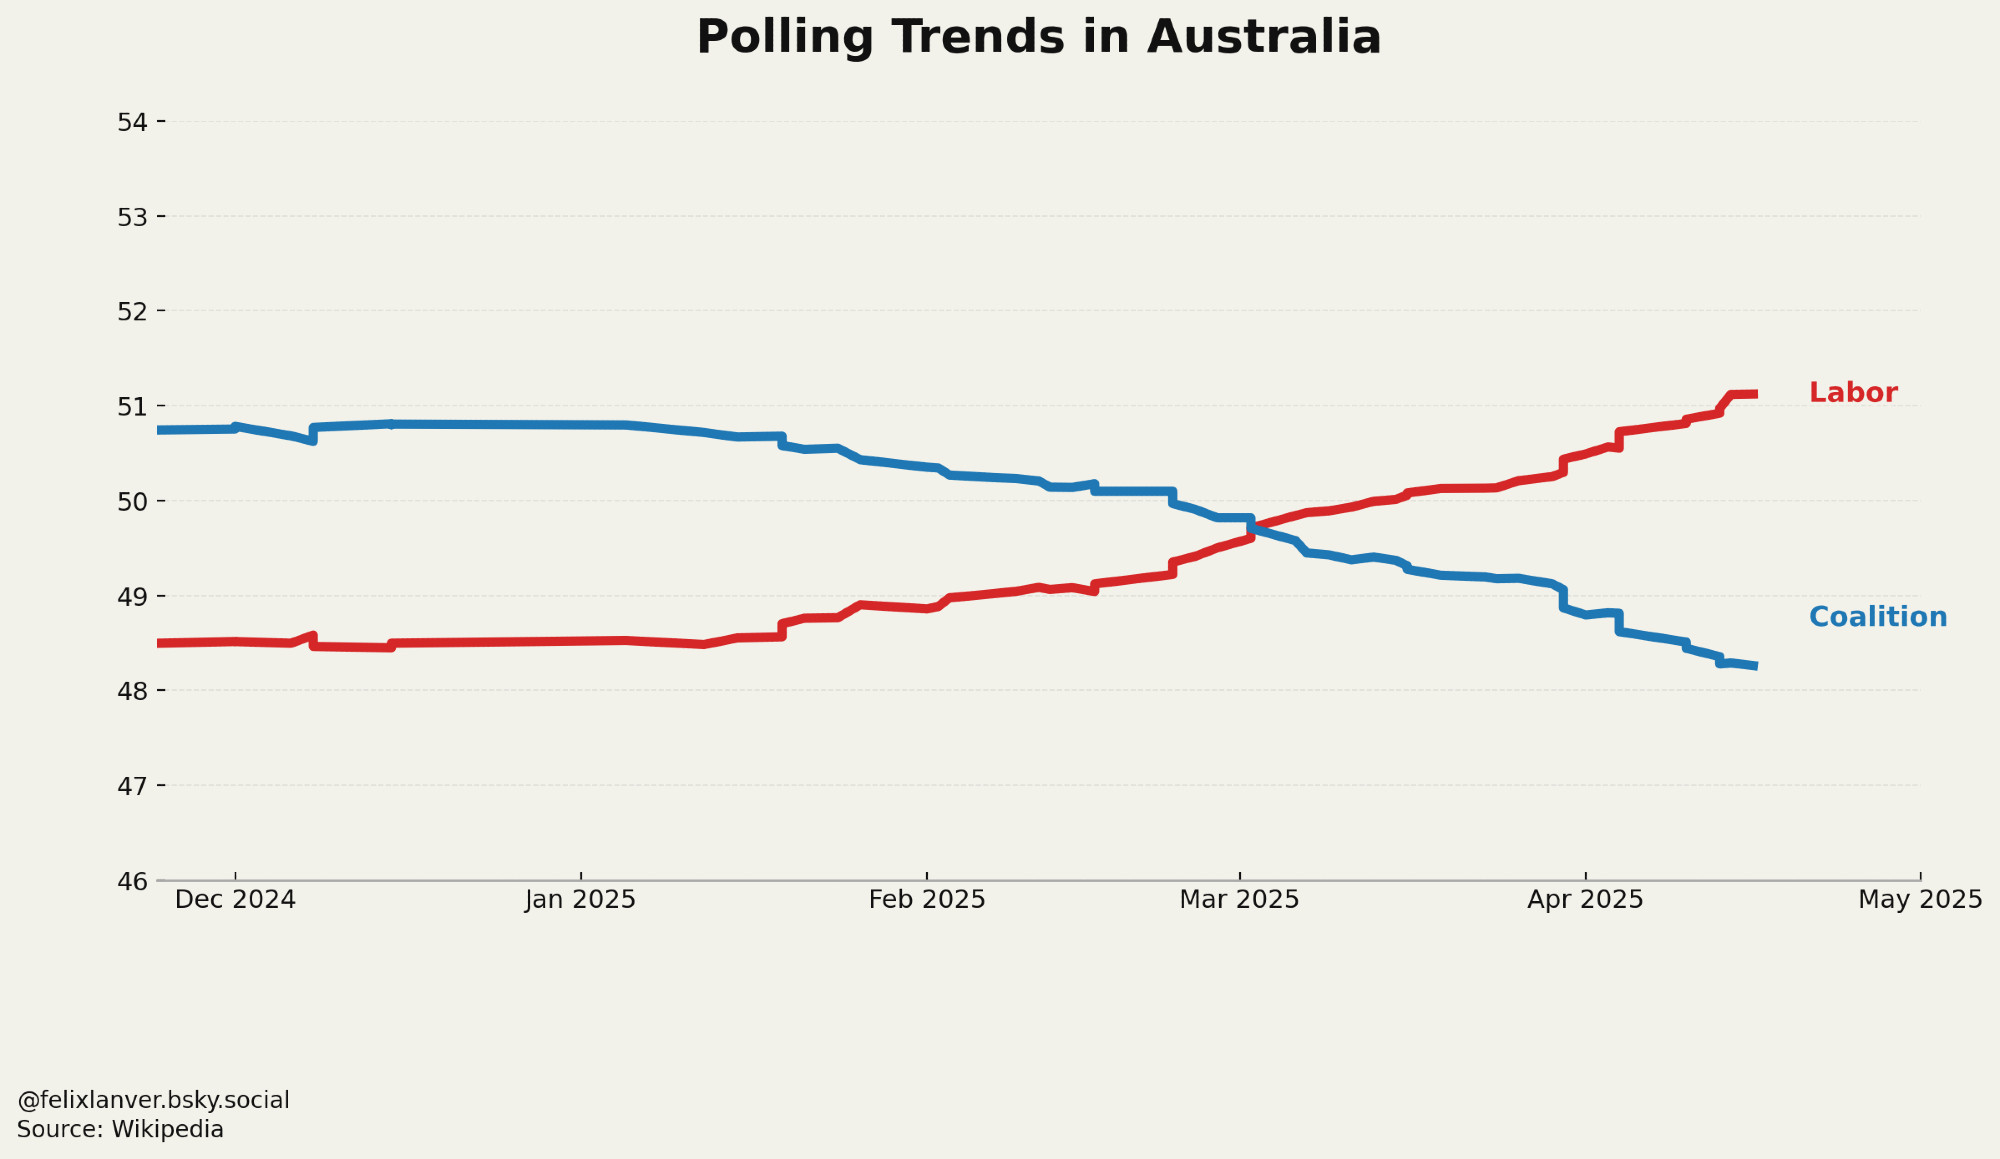
Election Polls: Australia
Australia heads to the polls on May 3rd. And similar to Canada, the incumbent party is making a small comeback.
Labor made up lost ground and recently took the lead in the two-party preferred polls.
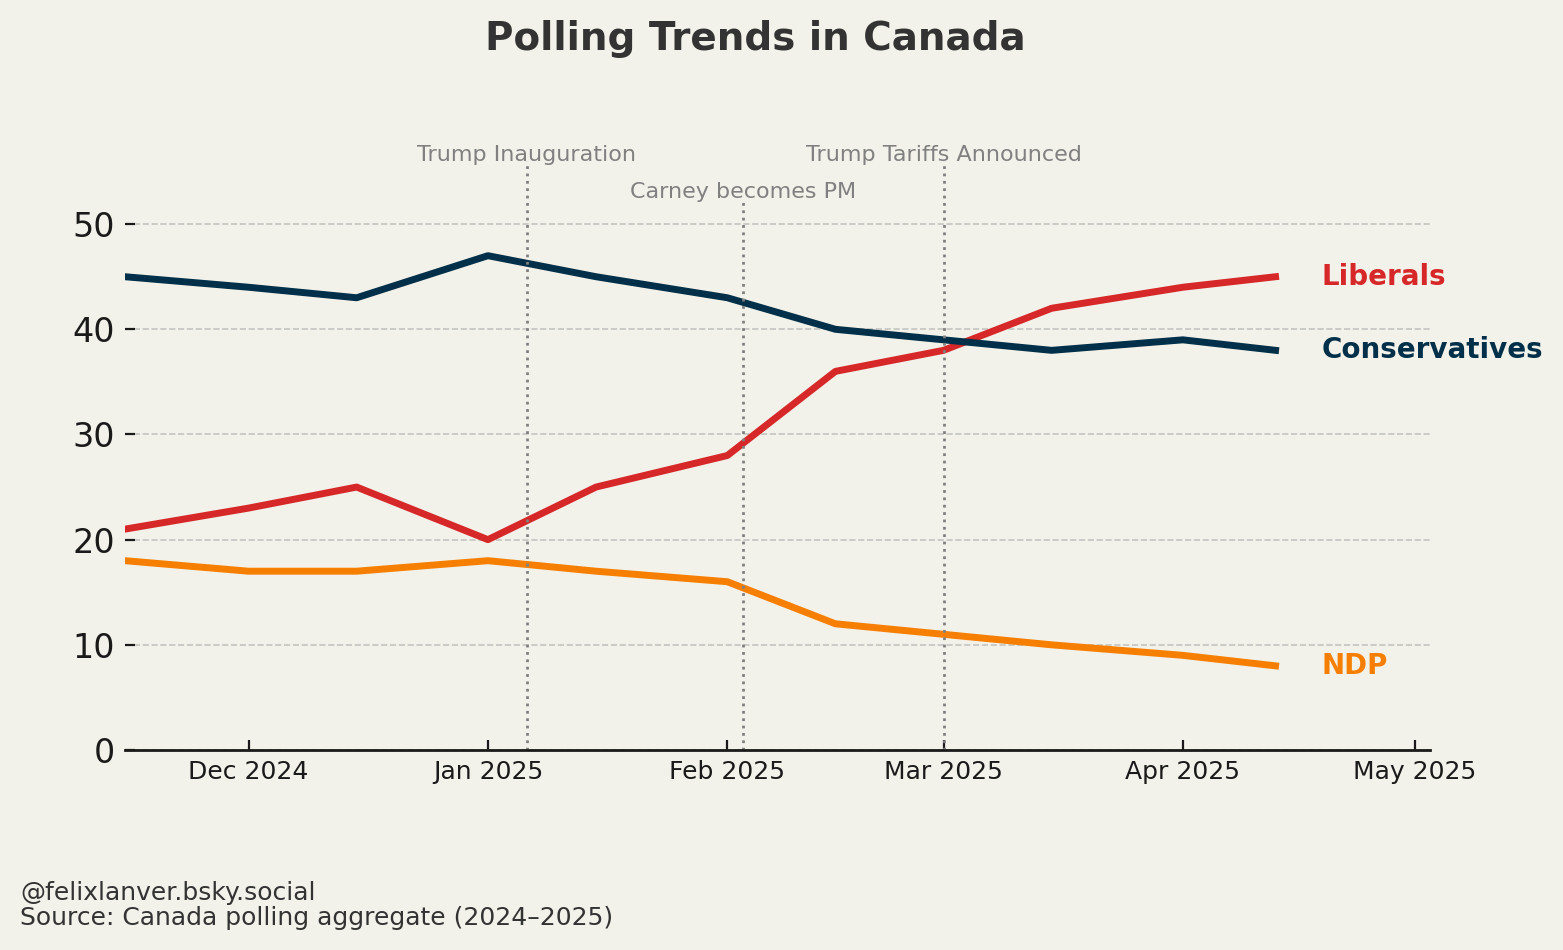
Election Polls: Canada
With only 5 days left until the Canadian Federal Election, the liberals are expected to win.
Liberals staged an unexpected comeback as Trump’s hostilities and Trudeau’s exit revived the party.
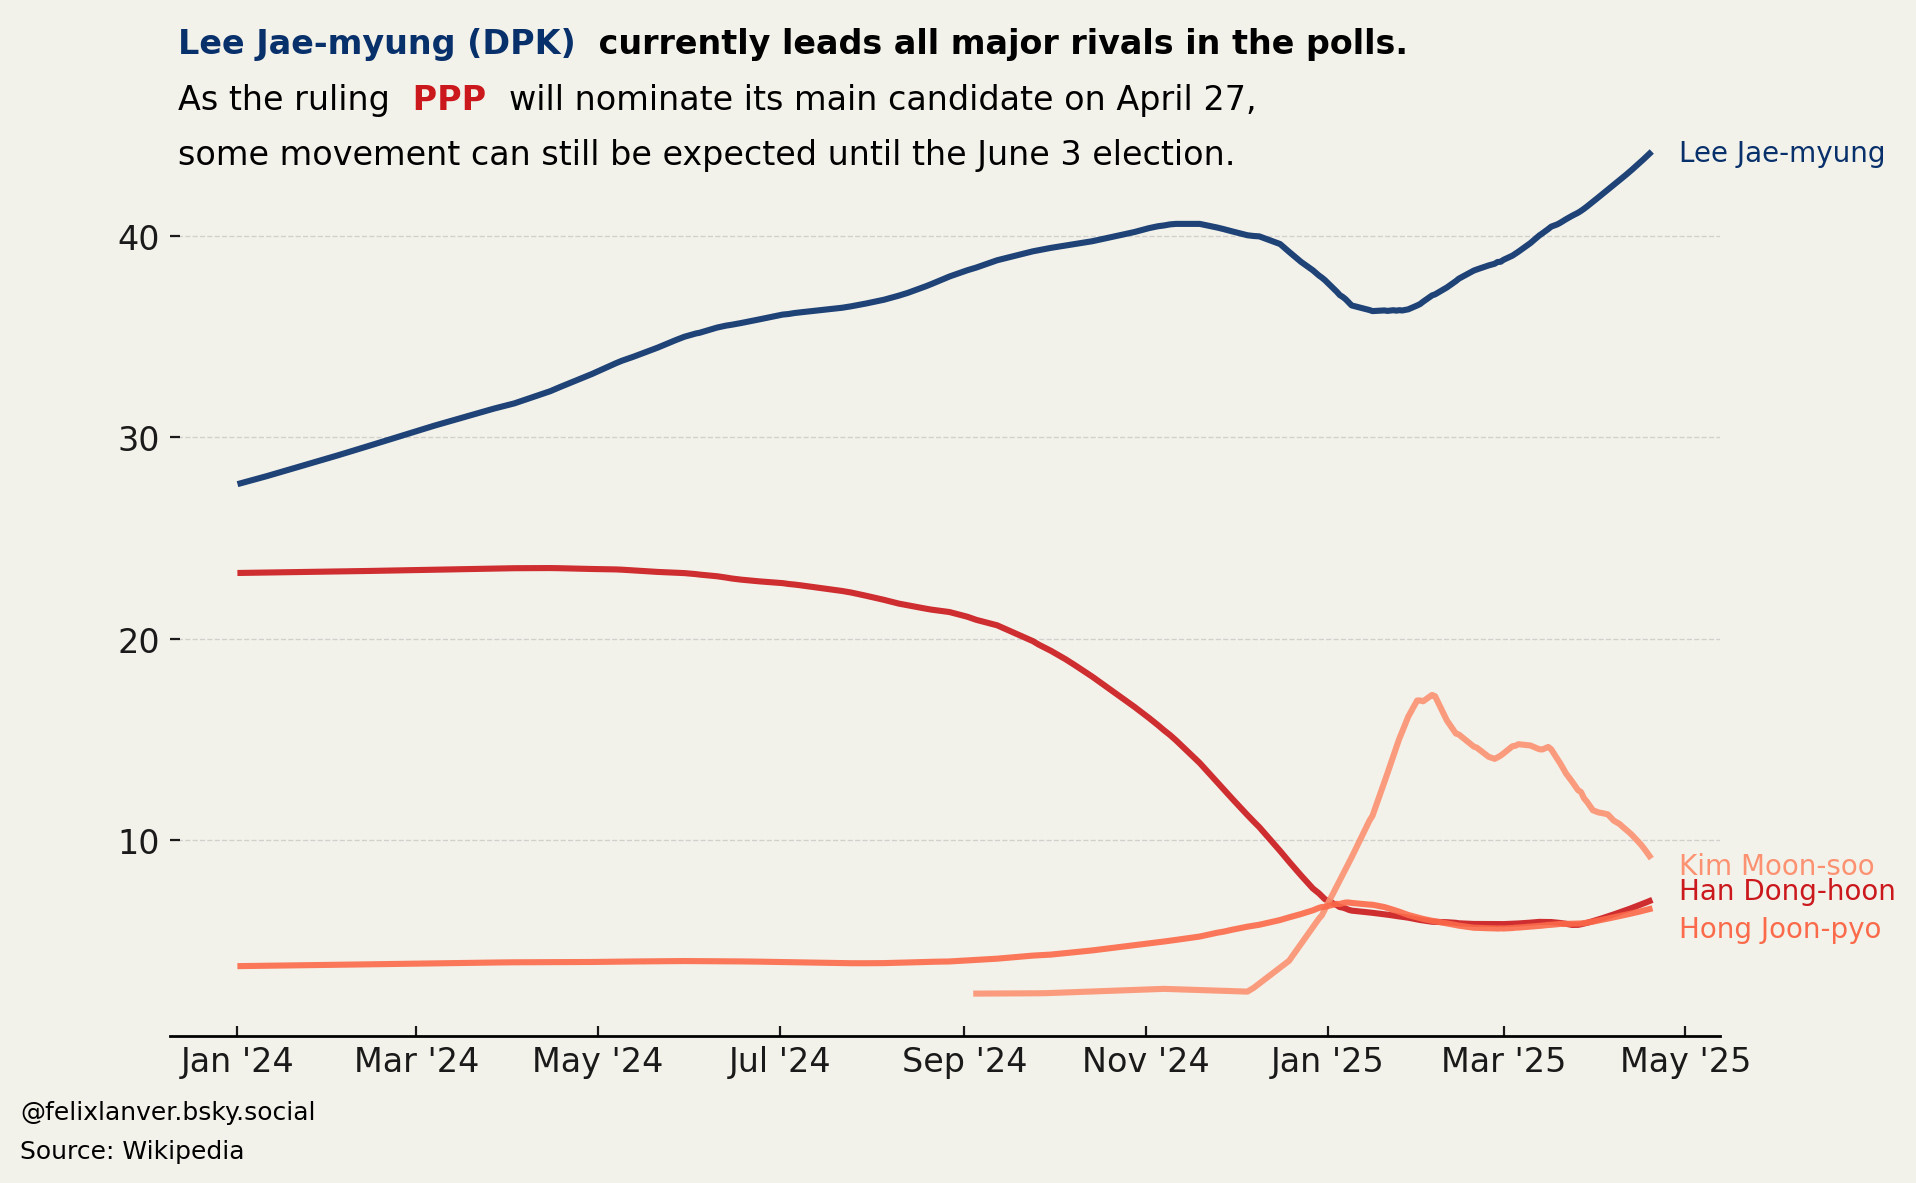
Election Polls: South Korea
🇰🇷 South Korea will elect a new president on June 3.
The snap election follows the impeachment and removal of President Yoon (PPP), after he declared martial law on December 3, 2024.
The president is elected in a single-round, first-past-the-post system for a non-renewable 5-year term.
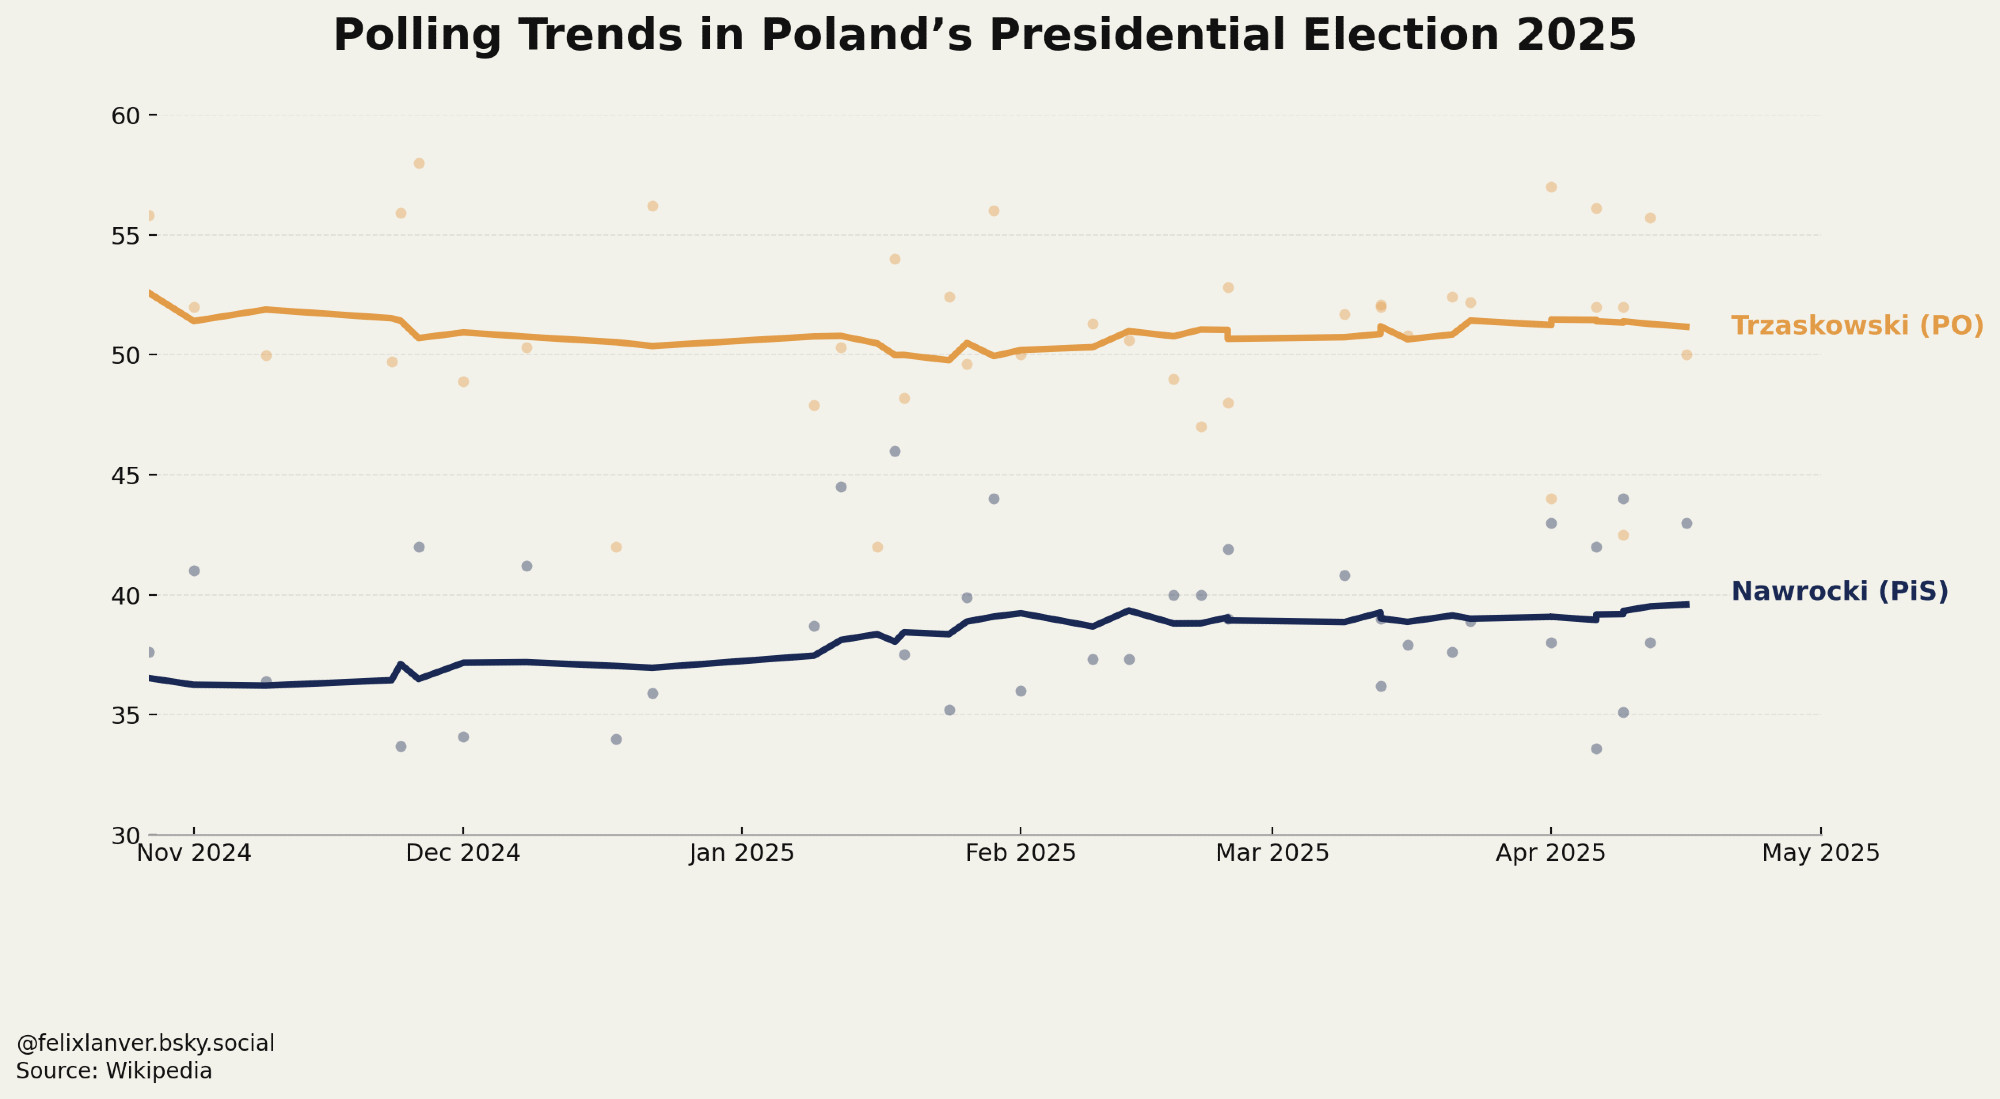
Election Polls: Poland
🇵🇱 Poland votes on 18 May (runoff 1 June).
With Andrzej Duda (PiS) term-limited, the race will decide his successor.
Polls show a comfortable lead for Trzaskowski (PO), candidate of Donald Tusk’s Civic Platform, the governing party since 2023.